Driver Score History & Factors
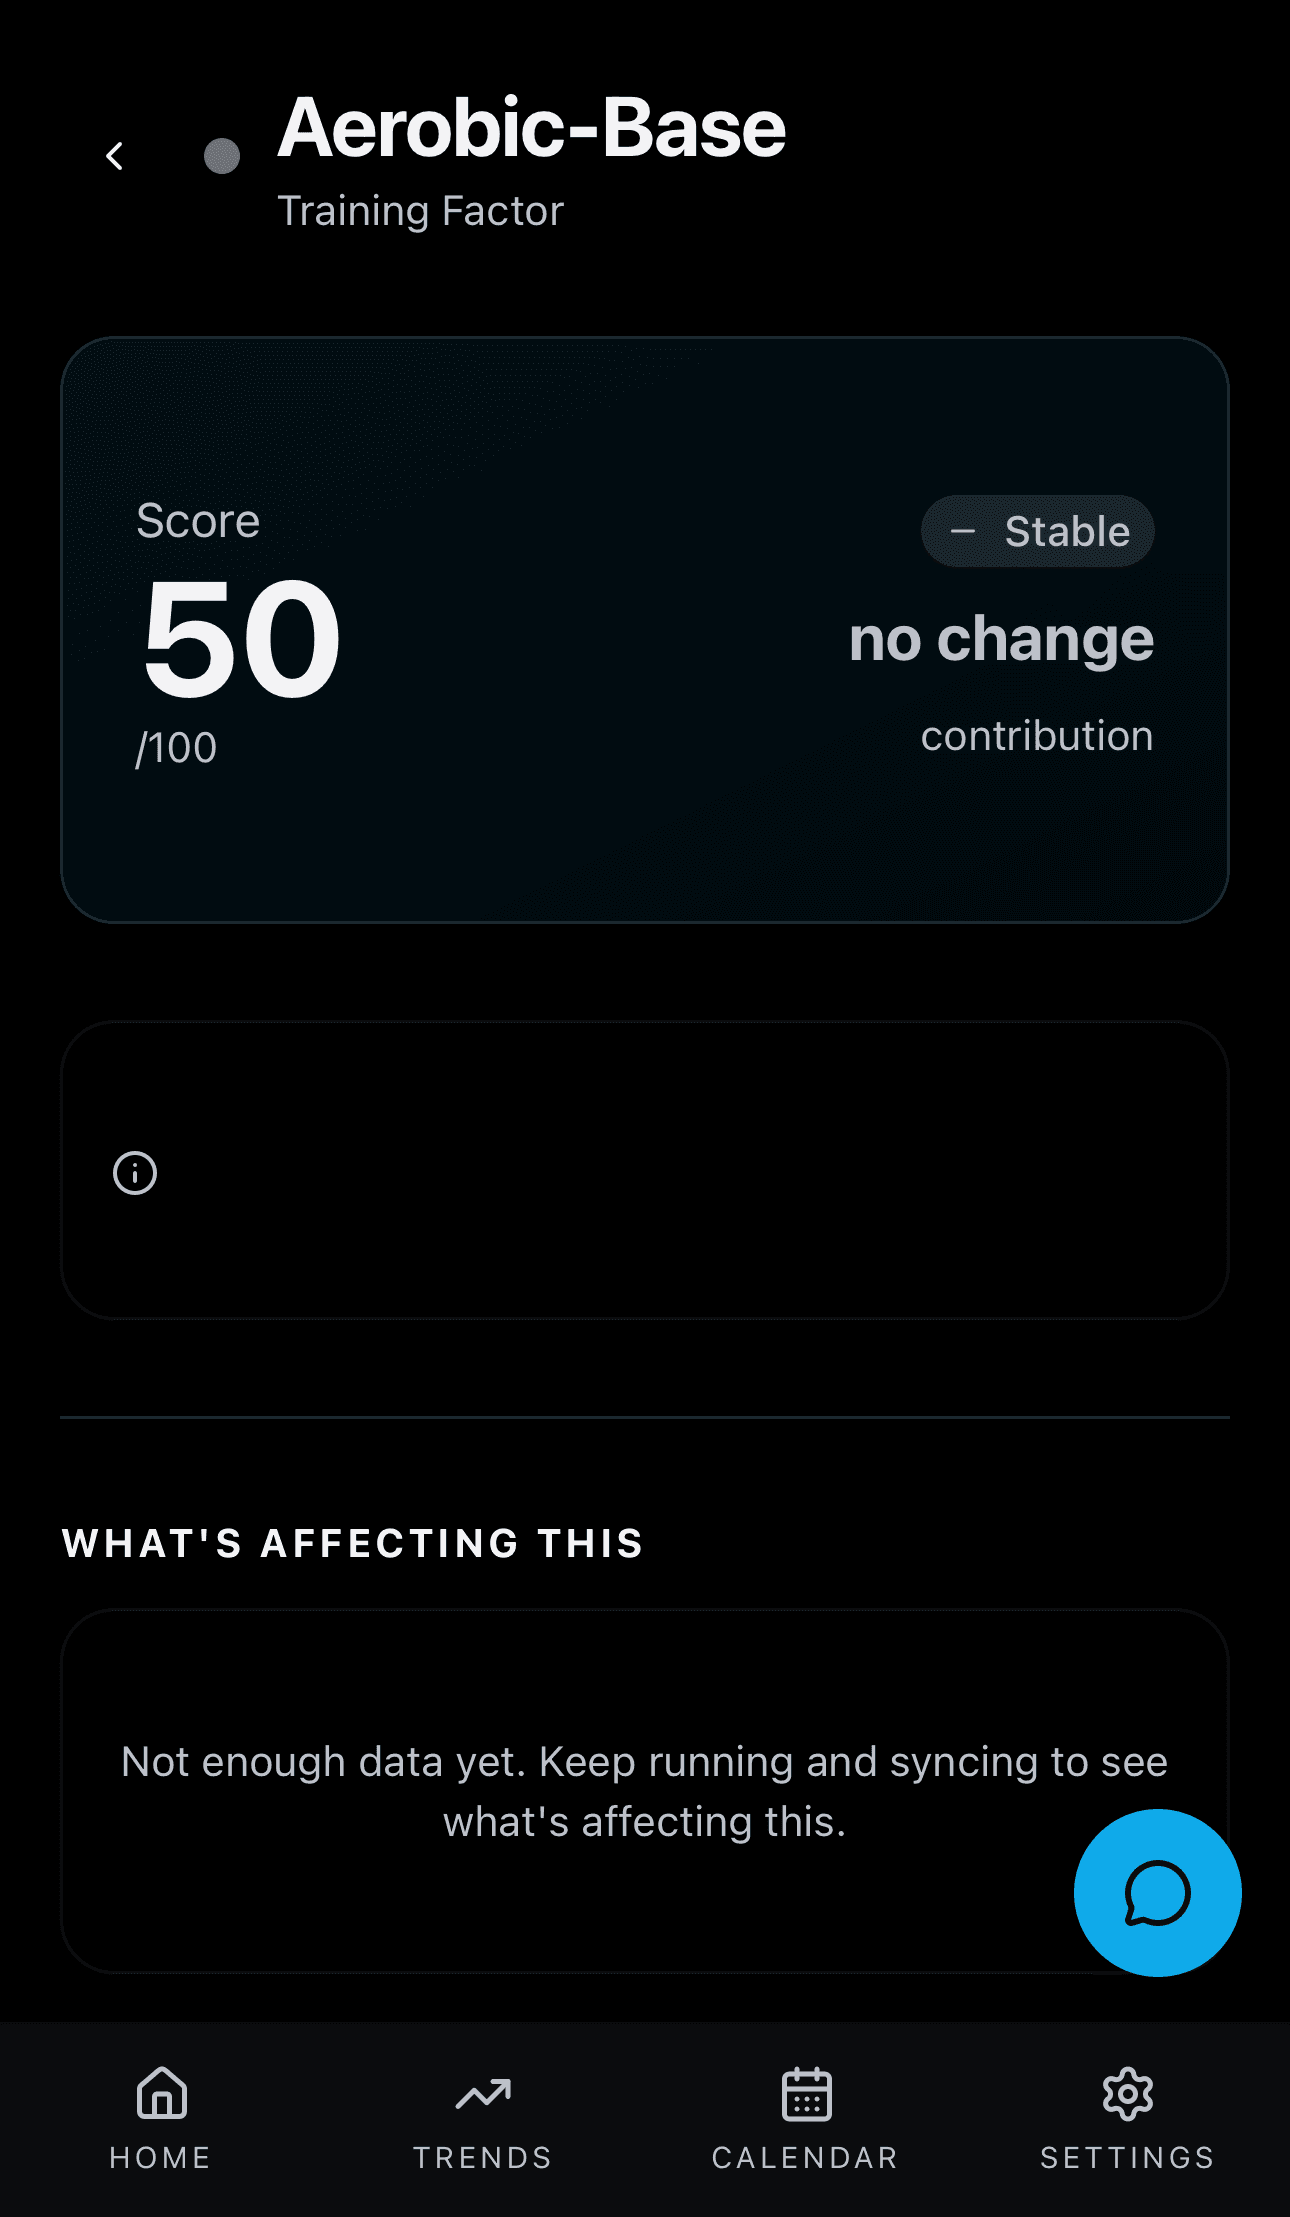
Source: src/app/(app)/driver/[driverName]/page.tsx
What You See
A colored dot matching the driver's color appears next to the driver name. Below is an area chart showing how the driver's score has changed over time. A 'What's Contributing' section lists the top factors with their contribution in seconds. A 'PIRX Insight' section gives a written explanation of what this driver means for your training.
How the Numbers Work
The score chart tracks this driver's 0-100 score over time. Higher scores mean the driver is contributing more positively. The contributing factors come from the SHAP explainer, showing which specific training metrics are pushing the score up or down. The PIRX Insight is a generated narrative that puts the numbers into everyday language.
Step by Step
Models & algorithms used: Gradient Boosting, SHAP
The driver name in the URL determines which driver to display. The score time series comes from the projection_history table, where each row stores all five driver scores alongside the projection. The area chart plots this driver's 0-100 score over time. SHAP factors come from shap.TreeExplainer on the Gradient Boosting model (or the heuristic baseline-ratio fallback if no model is loaded). The top factors are filtered by the DRIVER_FEATURE_MAP to show only features that belong to this driver. The narrative insight is generated by a template engine that takes the driver name, score, trend direction, and top factor and produces a plain-English explanation of what it means for your training.