Predictive Injury Calendar
How PIRX shows injury risk and training readiness on your Calendar — today's status, past days, and a 14-day forecast of when to push and when to back off.
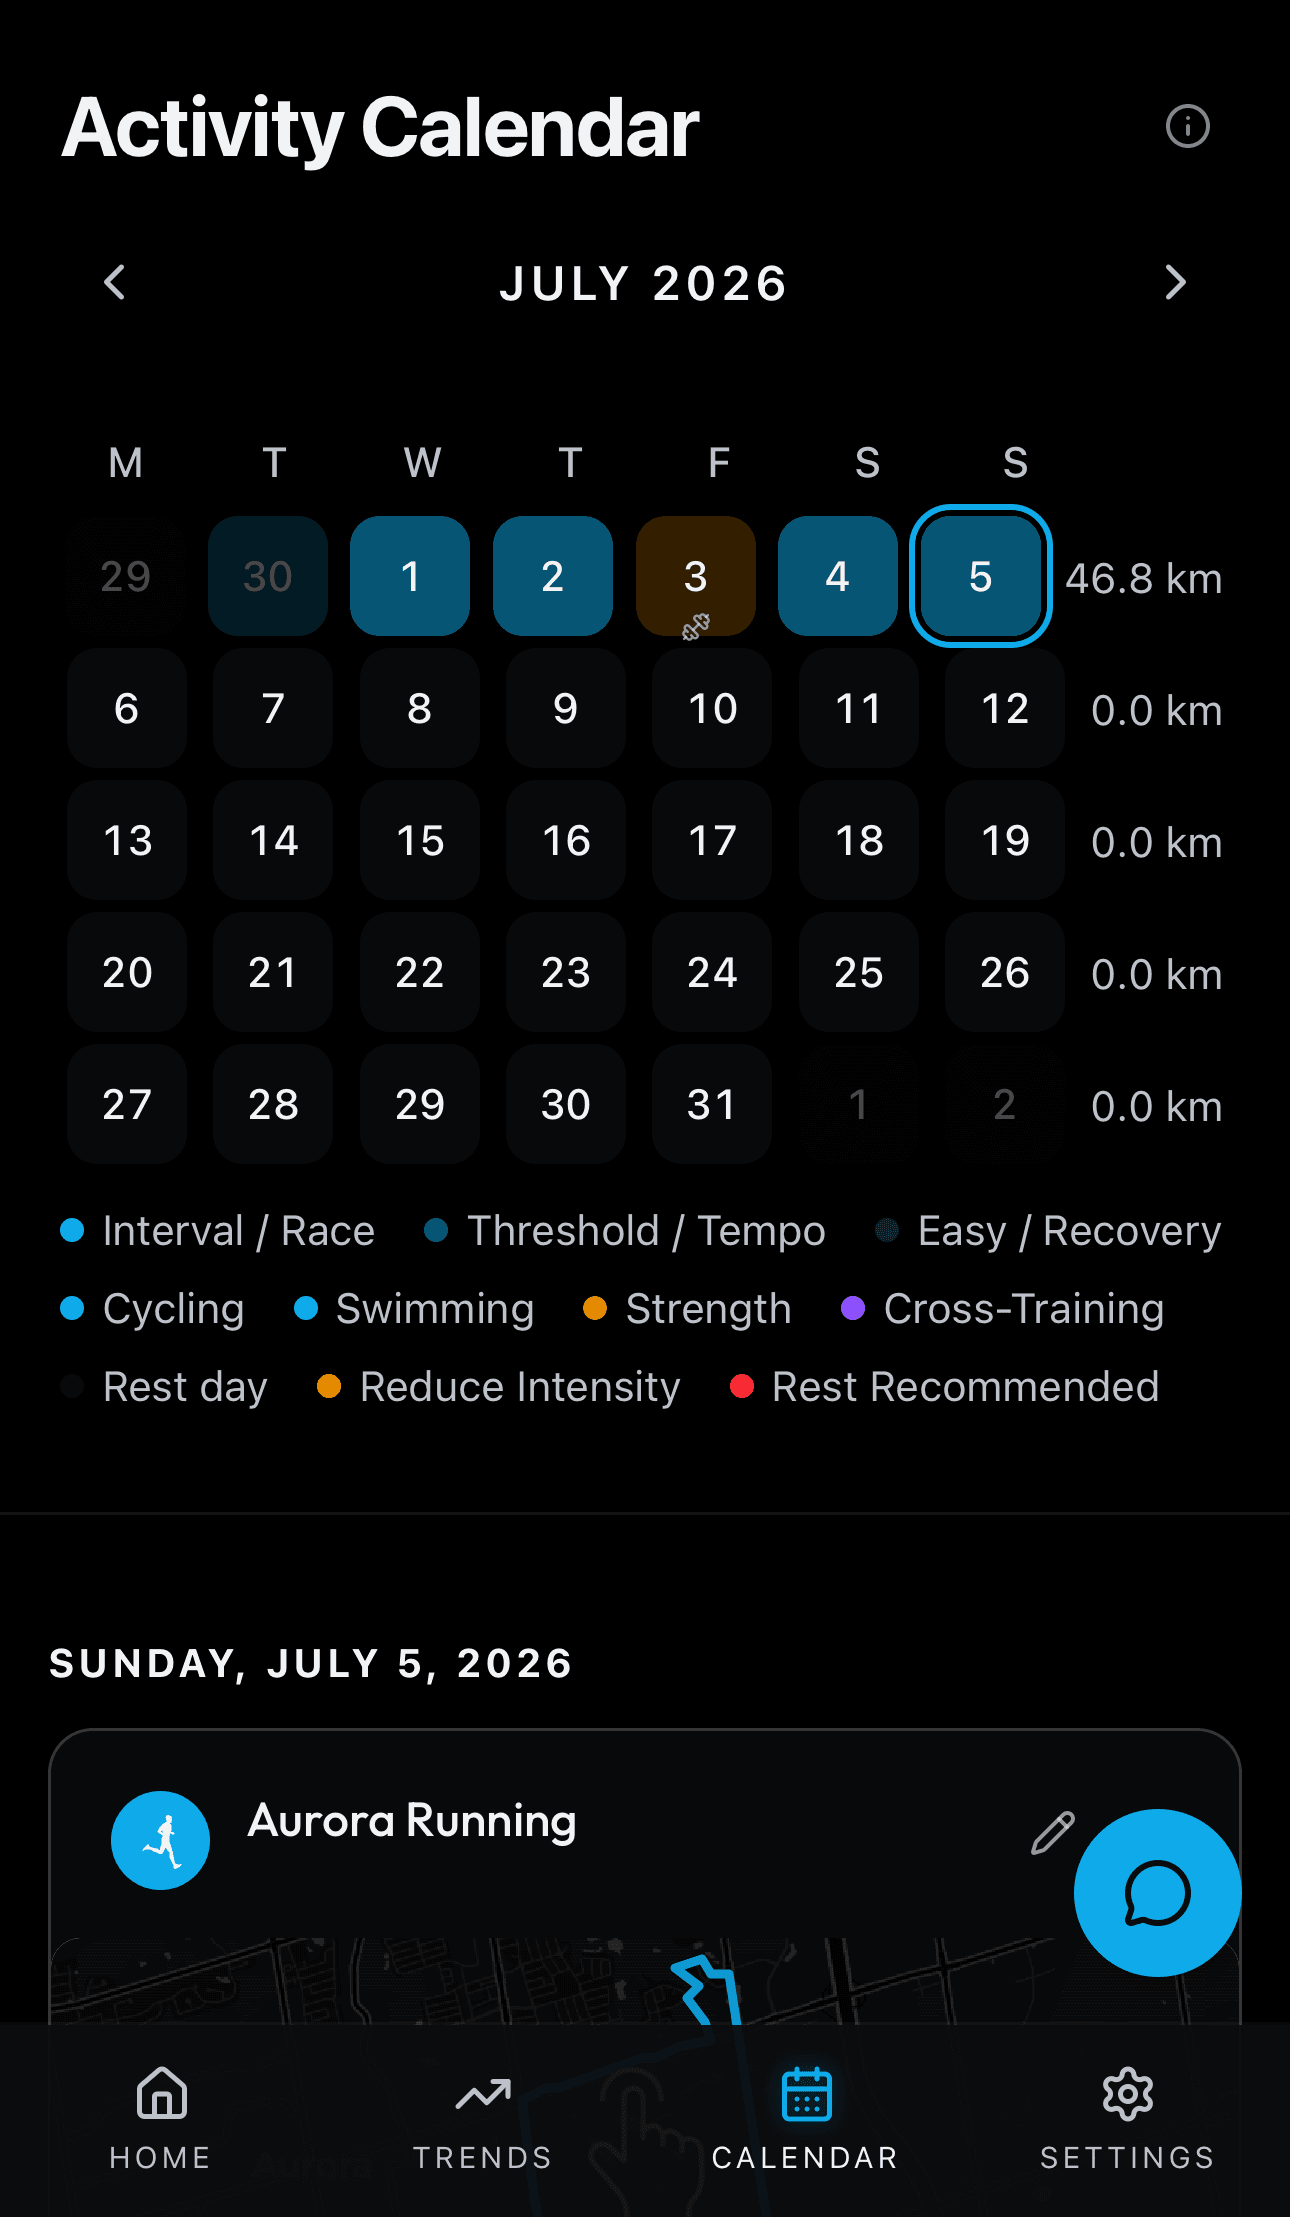
The Calendar is PIRX's predictive injury calendar: a month view where every day gets a color ring showing whether you're safe to train hard, should ease off, or need rest — including a 14-day look ahead. It combines your Injury Risk score, Event Readiness, and training load (ACWR) into one at-a-glance signal so you can spot trouble before it becomes a missed race.
What the rings mean
Each day on the Calendar can show a colored ring around the date:
| Ring | Meaning | What to do |
|---|---|---|
| Green | Good to train | Normal training is fine |
| Yellow | Reduce intensity | Ease off — load or recovery is drifting outside your normal range |
| Red | Rest recommended | Injury risk is elevated or readiness has dropped enough that a full rest day is warranted |
| No ring | No warning (or no forecast yet) | Either status is green, or the day is beyond the forecast window |
Tap a day to see your activities for that date. On today and past days, if the ring is yellow or red, a banner explains why — for example, elevated injury risk or a training load spike.
Measured days vs forecast days
Not every ring is calculated the same way:
- Today is computed live from your latest synced data: training load, ACWR, sleep, HRV, resting heart rate, and your current Injury Risk.
- Past days use the data PIRX stored for that day — what your load and risk actually were, not a retroactive guess.
- The next 14 days are a forecast: PIRX simulates what happens if you keep training at your recent pattern. Forecast rings appear slightly dimmer so you can tell them apart from measured days at a glance.
Forecast days answer a practical question: "If I keep doing what I'm doing, when does load catch up with me?" They are a what-if preview, not a prescription. PIRX does not show yellow/red action banners on forecast days — only on measured days where the signal is based on real data.
Beyond 14 days out, there is no forecast yet. Those days show no ring, and the day detail card says No forecast available for this day yet.
What goes into the color
The ring is not just Injury Risk alone. PIRX classifies each day from combined signals:
- Injury Risk — how likely you are to get hurt right now from load spikes and recovery gaps (see Injury Risk (Analysis))
- Event Readiness — whether your body is recovered enough to absorb hard training
- Training load (ACWR) — whether recent volume is rising faster than your body is used to
- Load consistency — whether your weekly training is steady or erratic
A day turns red when injury risk is high, readiness is very low, or load has spiked sharply. Yellow means moderate risk, low readiness, or elevated ACWR. Green means none of those thresholds are crossed.
How to use it in a training block
- Check today first. If the ring is red, treat it as a rest day even if your plan says intervals. The calendar is surfacing a risk the plan cannot see.
- Scan the next two weeks. Dim rings on future days show where your current pattern is heading. If every day ahead is yellow, that's a signal to add easy days or cut volume now — not after you're hurt.
- Compare with Performance. Tap through to Injury Risk or Event Readiness for the full score, band, and "Why this number?" breakdown. The calendar is the summary; Performance is the detail.
- Turn on alerts (optional). In Settings you can enable training status notifications. PIRX will push when a measured day turns yellow or red so you don't have to open the app to notice.
What the forecast assumes — and what it does not
The 14-day forecast assumes you maintain your recent training pattern — same kind of volume and frequency as the last week or so. It does not know your race plan, scheduled rest week, or a coach's periodization. If you're about to taper or take a deload, the forecast may look worse than what you intend; that's expected.
The forecast also does not replace running. Cross-training counts toward load on the dashboard, but the calendar rings focus on the signals that drive injury risk for runners.
Related pages
- Activity Calendar — activities, dots, week totals, and Zone Predictor from a selected run
- Injury Risk (Analysis) — the full risk score and factor breakdown
- Event Readiness (Analysis) — race-readiness bands and components
- Recovery & Body (Analysis) — sleep, HRV, and stress inputs
Calendar
Your training log on a monthly grid — plus PIRX's predictive injury calendar with green, yellow, and red status rings and a 14-day injury-risk forecast.
Activity Calendar
The monthly activity grid — colored run dots, week totals, day detail, and training status rings. See Predictive Injury Calendar for what the rings mean.