Recovery & Body (Analysis)
Source: (inline in performance/page.tsx)
What You See
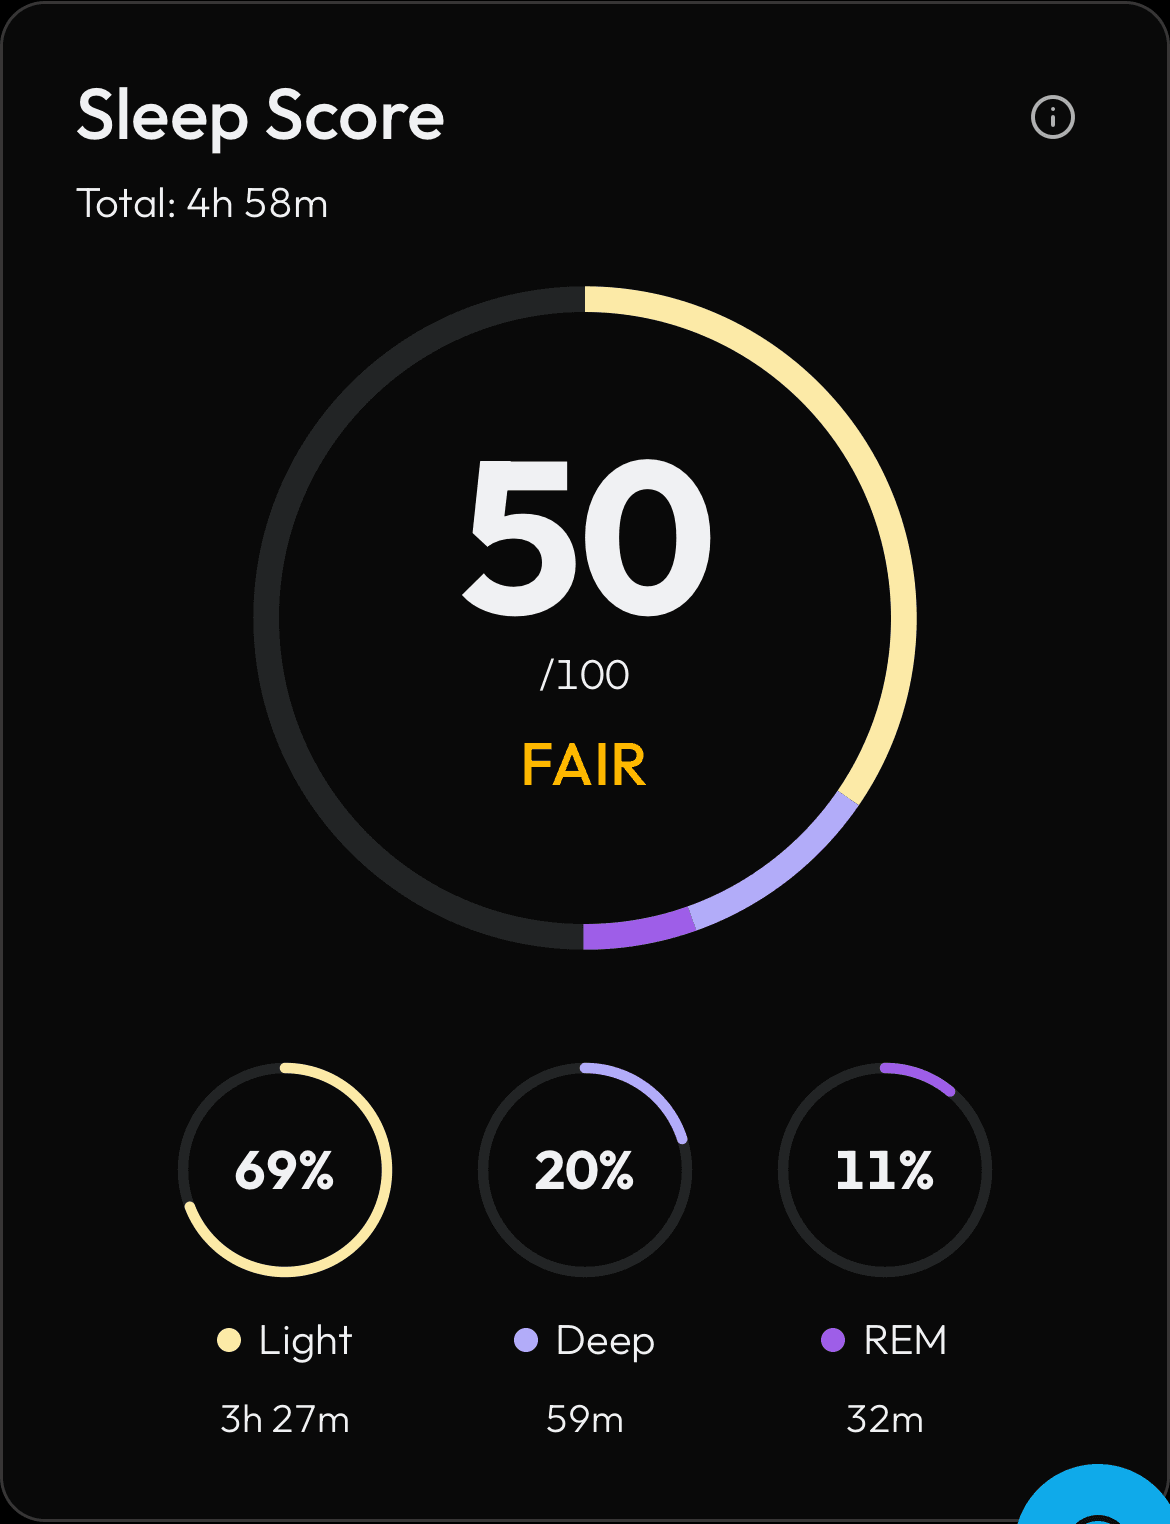
A full detail view of sleep score, weight, body fat, resting heart rate, HRV, sleep breakdown (a colored bar split into Deep, Light, and REM), VO2max, and stress level. A 'Why this number?' panel explains the data source.
How the Numbers Work
All values come from your wearable's latest sync. Resting HR is measured while you sleep. HRV (Heart Rate Variability) measures the variation between heartbeats -- higher is generally better and means your body is recovered. Sleep breakdown shows what portion of your sleep was in each stage.
Step by Step
Same physiology row as the dashboard, plus resting HR and HRV from normalize_daily_entry. Physiological trends are computed by the feature service: it takes up to 14 recent physiology rows, splits them into the 7 most recent and the 7 older ones, computes the mean of each group, and subtracts to find the direction of change. This trend direction powers the 'improving' or 'declining' labels on each field. The sleep stage bar divides total sleep proportionally using deep, light, and REM seconds from the same row.