Recovery & Body Signals (Overview)
Source: (inline in performance/page.tsx)
What You See
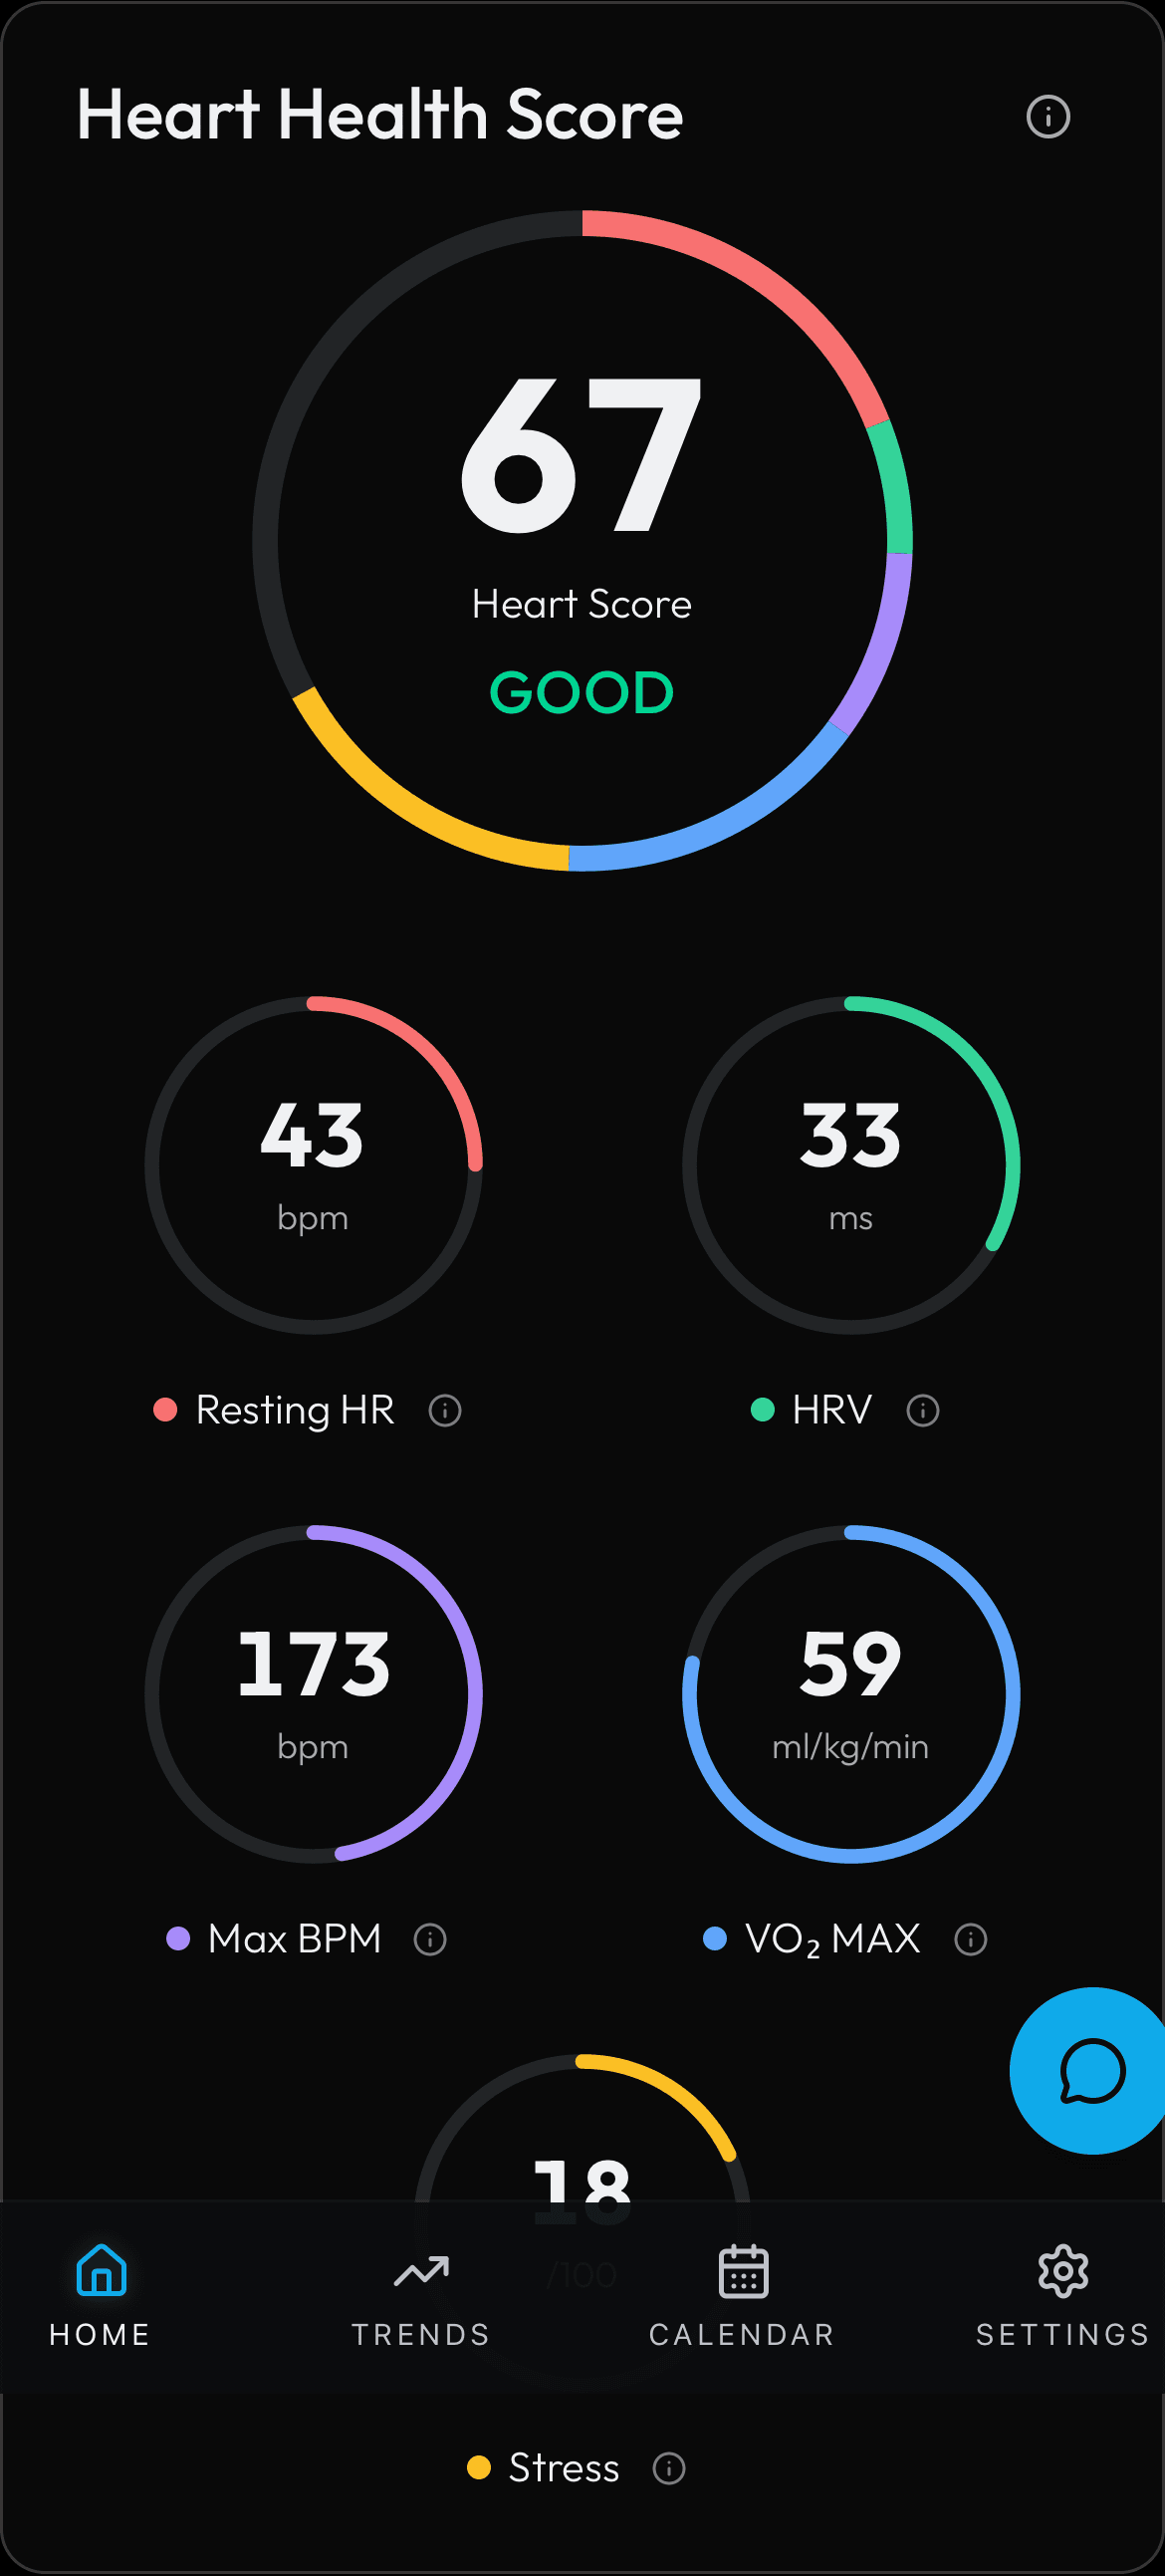
A grid showing Sleep Score, Weight, Body Fat, VO2max, and Stress from your wearable. There is a 'Why this number?' button you can tap to see where the data comes from.
How the Numbers Work
Same data as the dashboard Recovery & Body card. Values come from the most recent wearable sync. Sleep score is 0-100, VO2max is in ml/kg/min, and stress is an average level from heart rate variability patterns.
Step by Step
Same physiology table as the dashboard. Terra webhooks are normalized through normalize_sleep_entry (sleep score, deep/light/REM seconds), normalize_body_entry (weight, body fat), and normalize_daily_entry (resting HR, HRV, VO2max, stress). This card adds a static 'Why this number?' collapsible explaining each data source -- no additional server request is made.