Zone Distribution (Analysis)
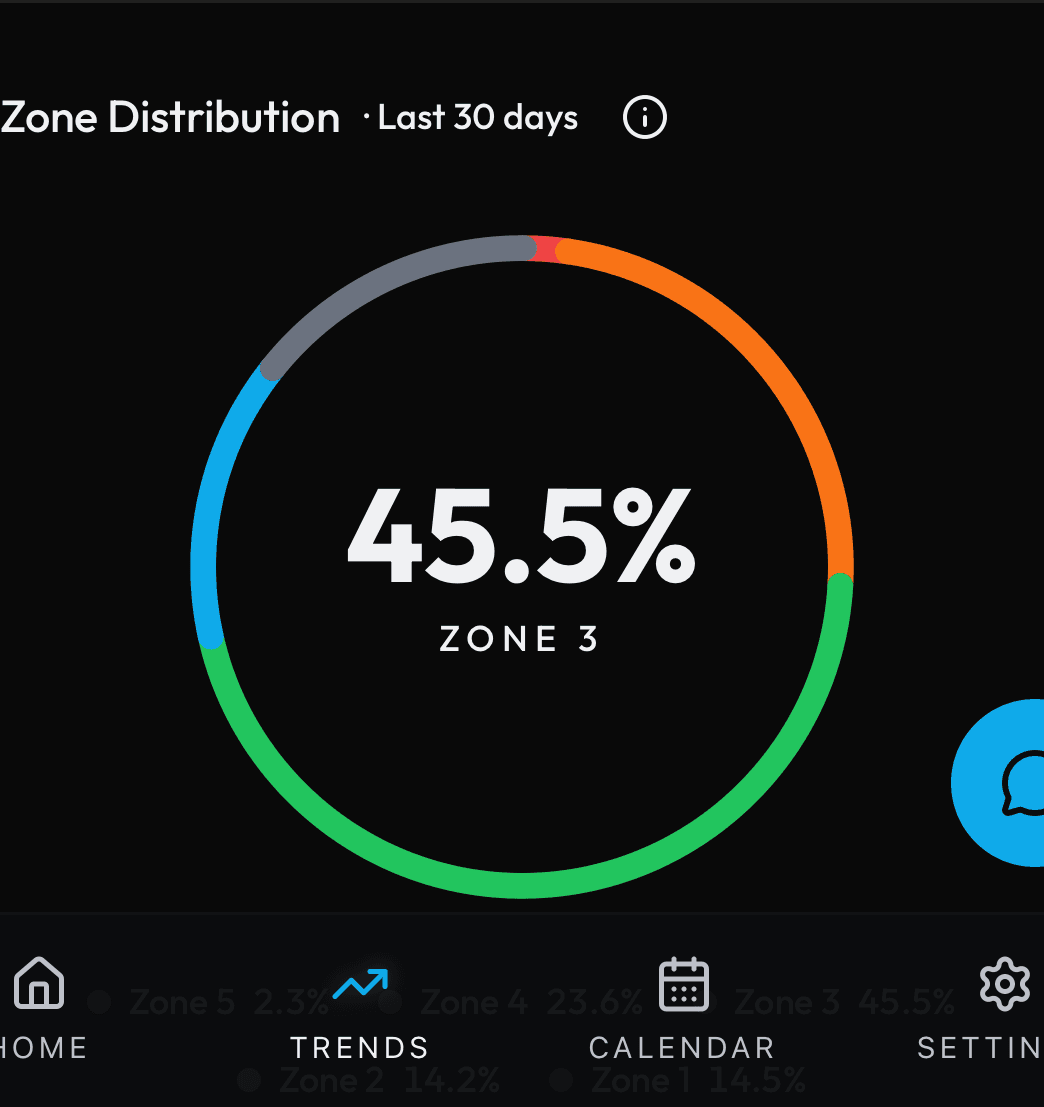
Source: (inline in performance/page.tsx)
What You See
A table of your five heart rate training zones (Zone 1 through Zone 5). Each row shows the zone name, the HR range, the pace range, and the percentage of time spent there. Below is a donut chart showing the 21-day zone split visually. A badge shows your Zone 2 efficiency gain.
How the Numbers Work
PIRX analyzes all your runs from the last 21 days and calculates how much time you spent in each heart rate zone. Zone 2 efficiency measures whether your easy-effort pace is getting faster at the same heart rate -- a sign of improving aerobic fitness.
Step by Step
The backend reads stored hr_zones from each activity over the last 21 days. Zones are defined by heart rate as a percentage of your max HR (default 190 bpm): Zone 1 is below 60 percent, Zone 2 is 60-70 percent, Zone 3 is 70-80 percent, Zone 4 is 80-90 percent, Zone 5 is 90 percent and above. If your wearable provides its own zone boundaries, those are used instead. Time in each zone is summed across all 21-day activities and expressed as a percentage of total running time. Methodology detection: if Zone 1 + Zone 2 time is below 60 percent and Zone 4 + Zone 5 time is above 25 percent, training is labeled Polarized; if Zone 1 + Zone 2 exceeds 75 percent, it is Pyramidal; otherwise Mixed. Zone 2 efficiency = (change in matched-HR-band pace over the 21-day window) -- how much faster you run at the same easy heart rate.