Injury Risk (Analysis)
Your injury risk score on the Performance tab — bands, factors, and how PIRX calculates it. Also shown as colored rings on the Calendar.
Injury Risk also appears on the Calendar as part of each day's green, yellow, or red training status ring, including a 14-day forecast. See Predictive Injury Calendar.
Source: (inline in performance/page.tsx)
What You See
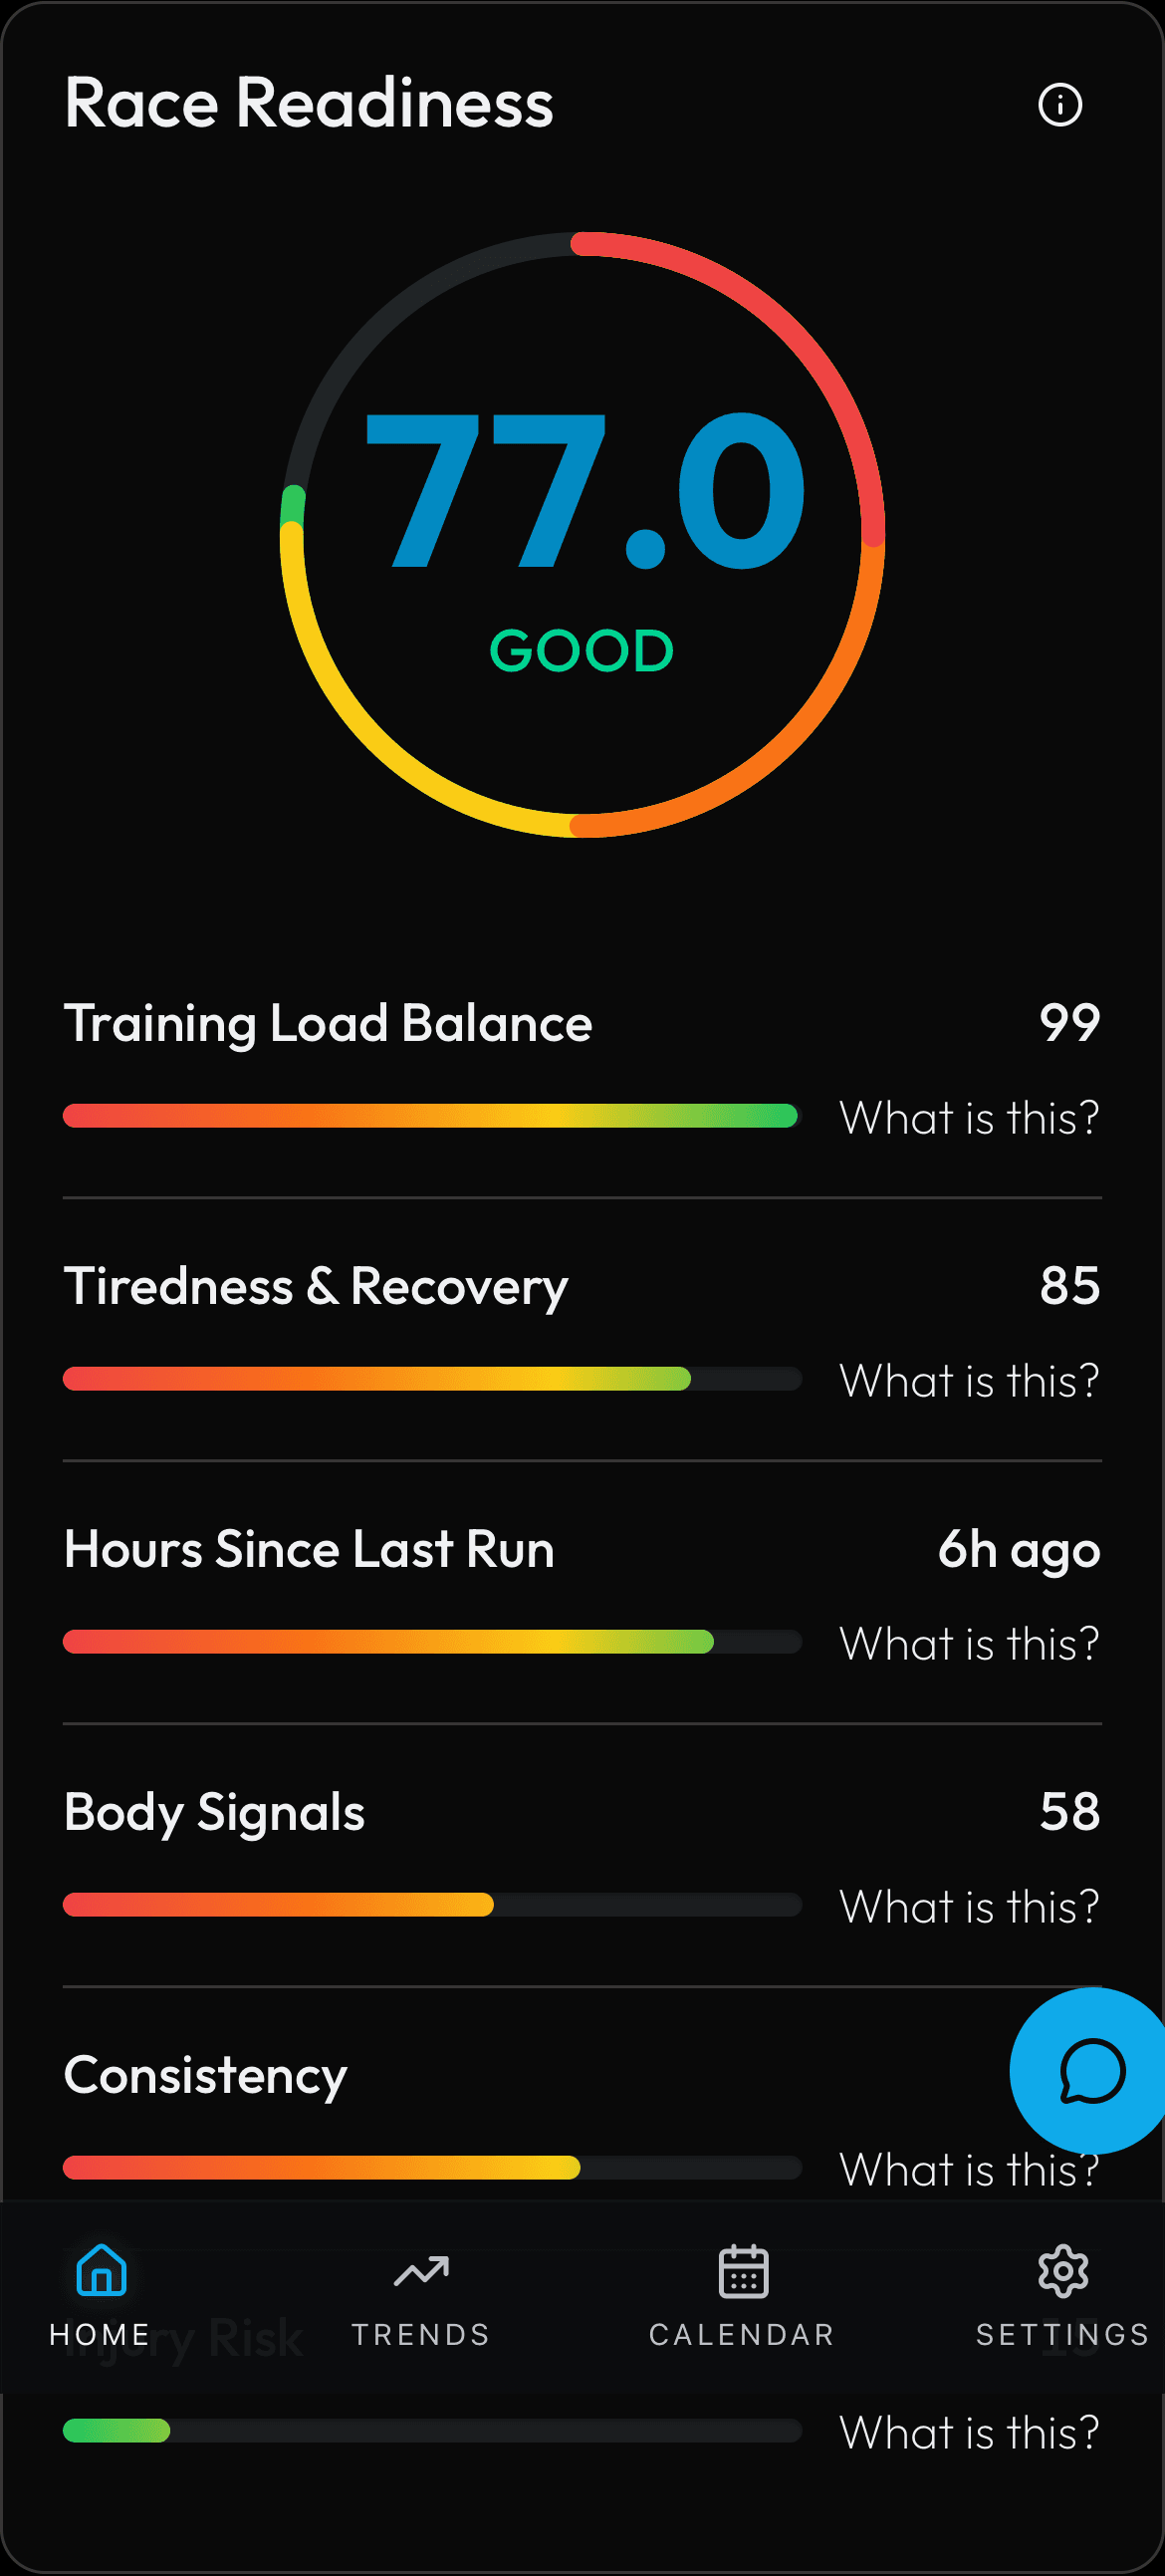
A score out of 100 with a colored band label: Low (green, below 35), Moderate (yellow, 35-59), or High (red, 60+). A description explains the risk factors. A 'Why this number?' panel shows individual risk factors with their impact.
How the Numbers Work
Injury risk is calculated from your recent training load, how consistent your training has been, and physiological strain signals. A sudden spike in training load (high ACWR), combined with poor sleep or high stress, increases the risk score. The band thresholds are: Low below 35, Moderate from 35 to 59, and High at 60 or above.
Step by Step
Models & algorithms used: Random Forest
Injury risk is computed by a dedicated Random Forest Regressor (200 trees, max depth 8, minimum 4 samples per leaf). The model is trained on labeled injury signals built from your history: a training gap longer than 14 days following an activity with ACWR above 1.4 gets a label of min(1, gap_days / 30); if pace also worsened by more than 10 percent, the label is raised to at least 0.7. Input features include current ACWR, 7-day load spike, weekly distance change, pace variance, sleep score, and HRV trend. If fewer than 30 training signals exist, PIRX uses a synthetic fallback Random Forest trained on 1,600 hand-built samples generated from a risk formula (weighted sum of ACWR deviation, load spike, low sleep, and high pace variance). Model output is piecewise calibrated to a 0-1 probability. Bands: below 0.35 = Low (green), 0.35-0.60 = Moderate (yellow), 0.60+ = High (red). The 'Why this number?' panel lists the top risk factors by feature importance from the Random Forest.