Structural Drivers (Analysis)
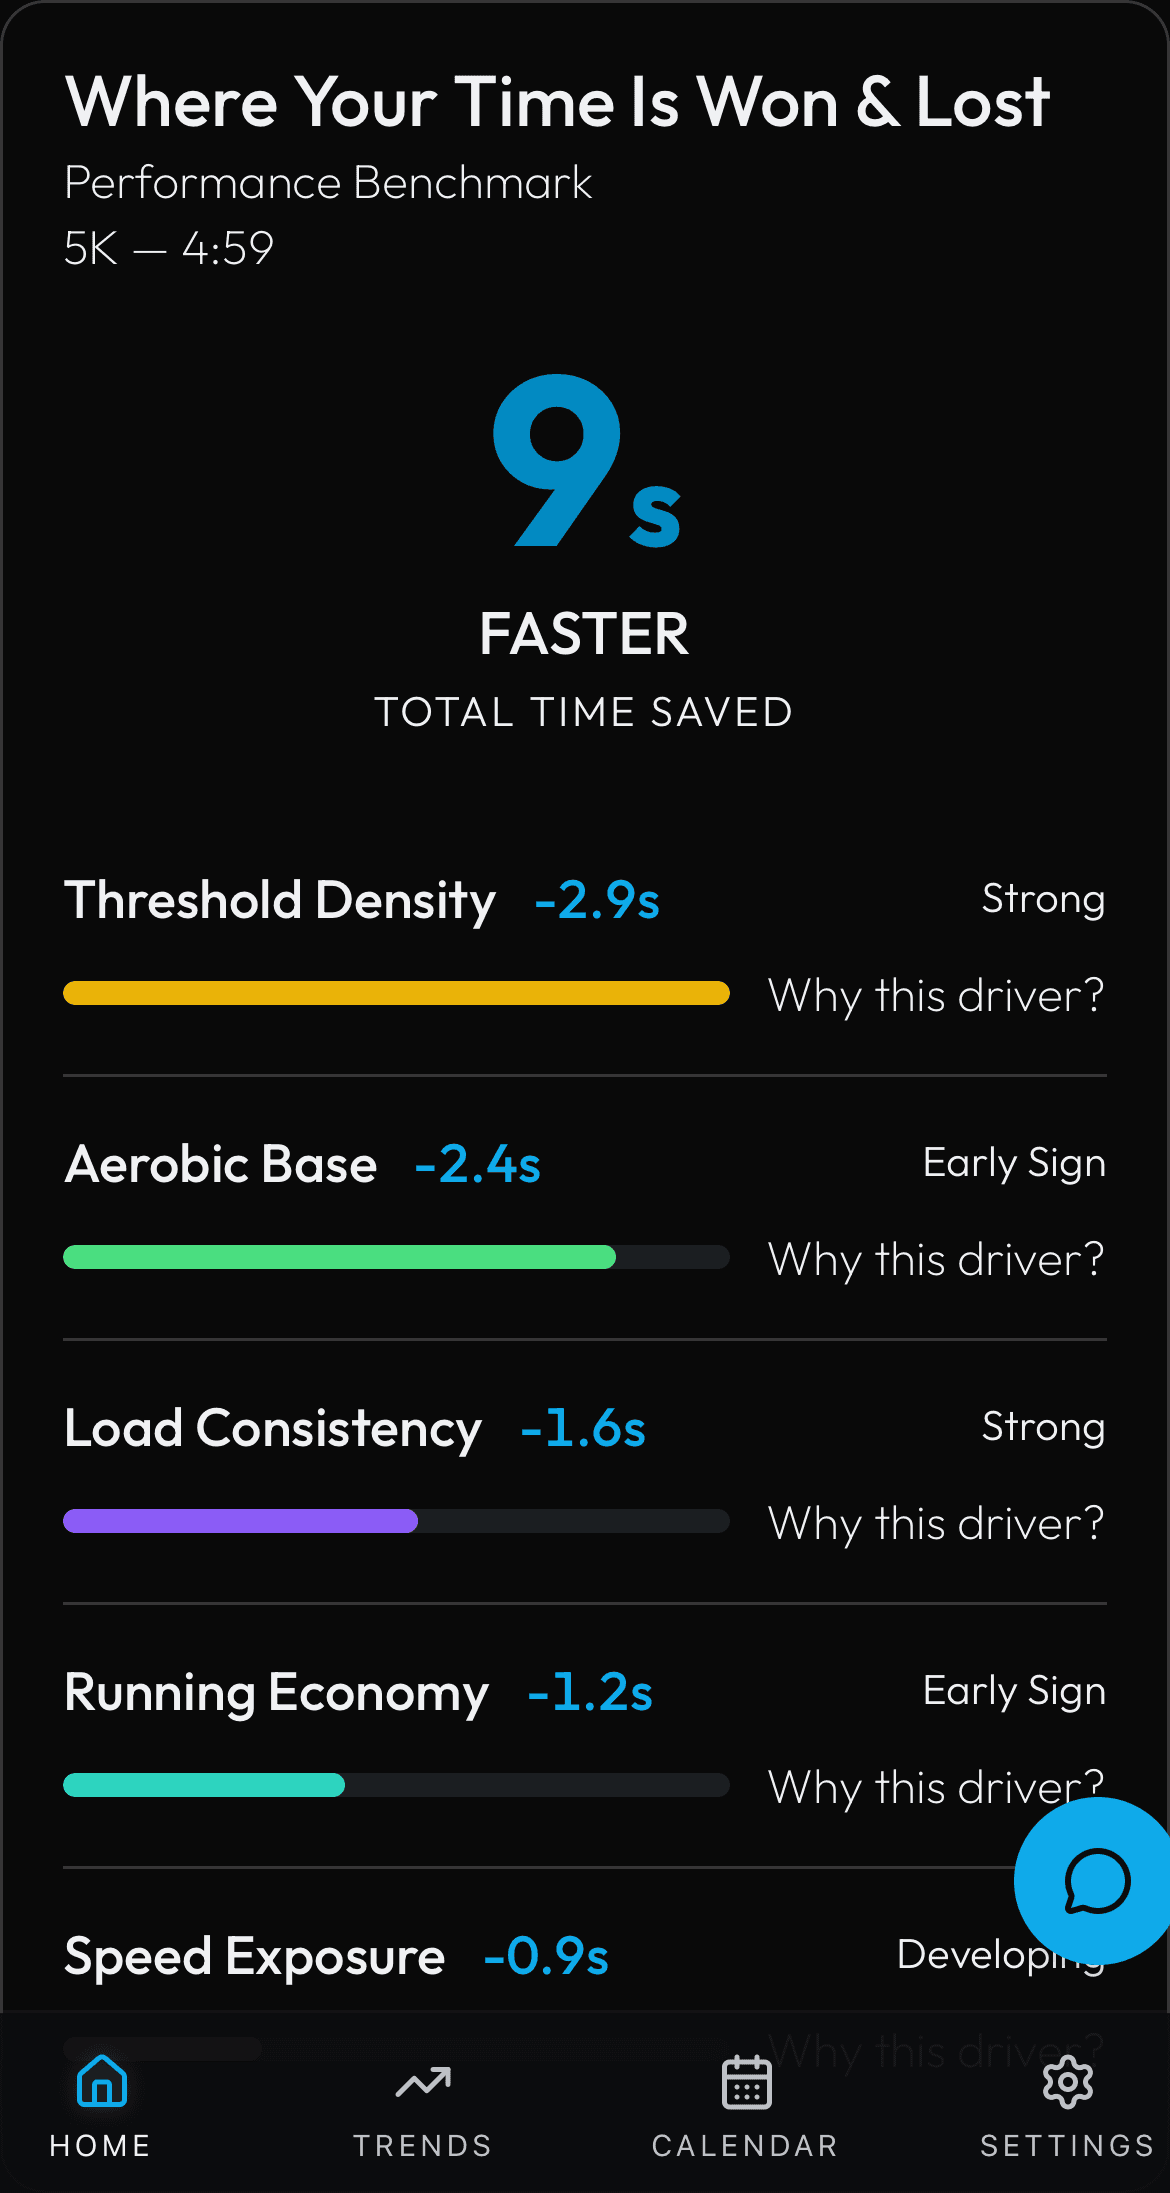
Source: (inline in performance/page.tsx)
What You See
Driver bars like the dashboard, plus expandable cards for each driver. Tapping 'Why this number?' on a driver shows its contributing factors labeled as Helping, Hurting, or Neutral, each with a seconds value. A 'How to read this' box explains the scoring.
How the Numbers Work
The factor breakdown uses SHAP values -- a method from machine learning that shows how much each input feature contributed to the driver's score. A factor marked 'Helping' means that input is making your projection faster. 'Hurting' means it is making your projection slower.
Step by Step
Models & algorithms used: Gradient Boosting, SHAP
Driver bars show the same scores and seconds as the dashboard (see Driver Strip). When you expand 'Why this number?' on a driver, the backend runs SHAP (SHapley Additive exPlanations) using shap.TreeExplainer on the Gradient Boosting model. SHAP maps each of the 17 input features to a signed contribution. These are grouped using DRIVER_FEATURE_MAP (for example, rolling_distance_7d and z1_pct both roll up to Aerobic Base). The top 3 features by absolute SHAP value are returned with their direction (Helping = positive, Hurting = negative) and magnitude in seconds. If no trained model is loaded, the heuristic fallback compares each feature's current value to its baseline: a ratio above 1.15 is labeled Improved, below 0.85 is Declined, and the delta in seconds is estimated from the feature's weight in the deterministic formula.