Baseline Race
Source: (inline in performance/page.tsx)
What You See
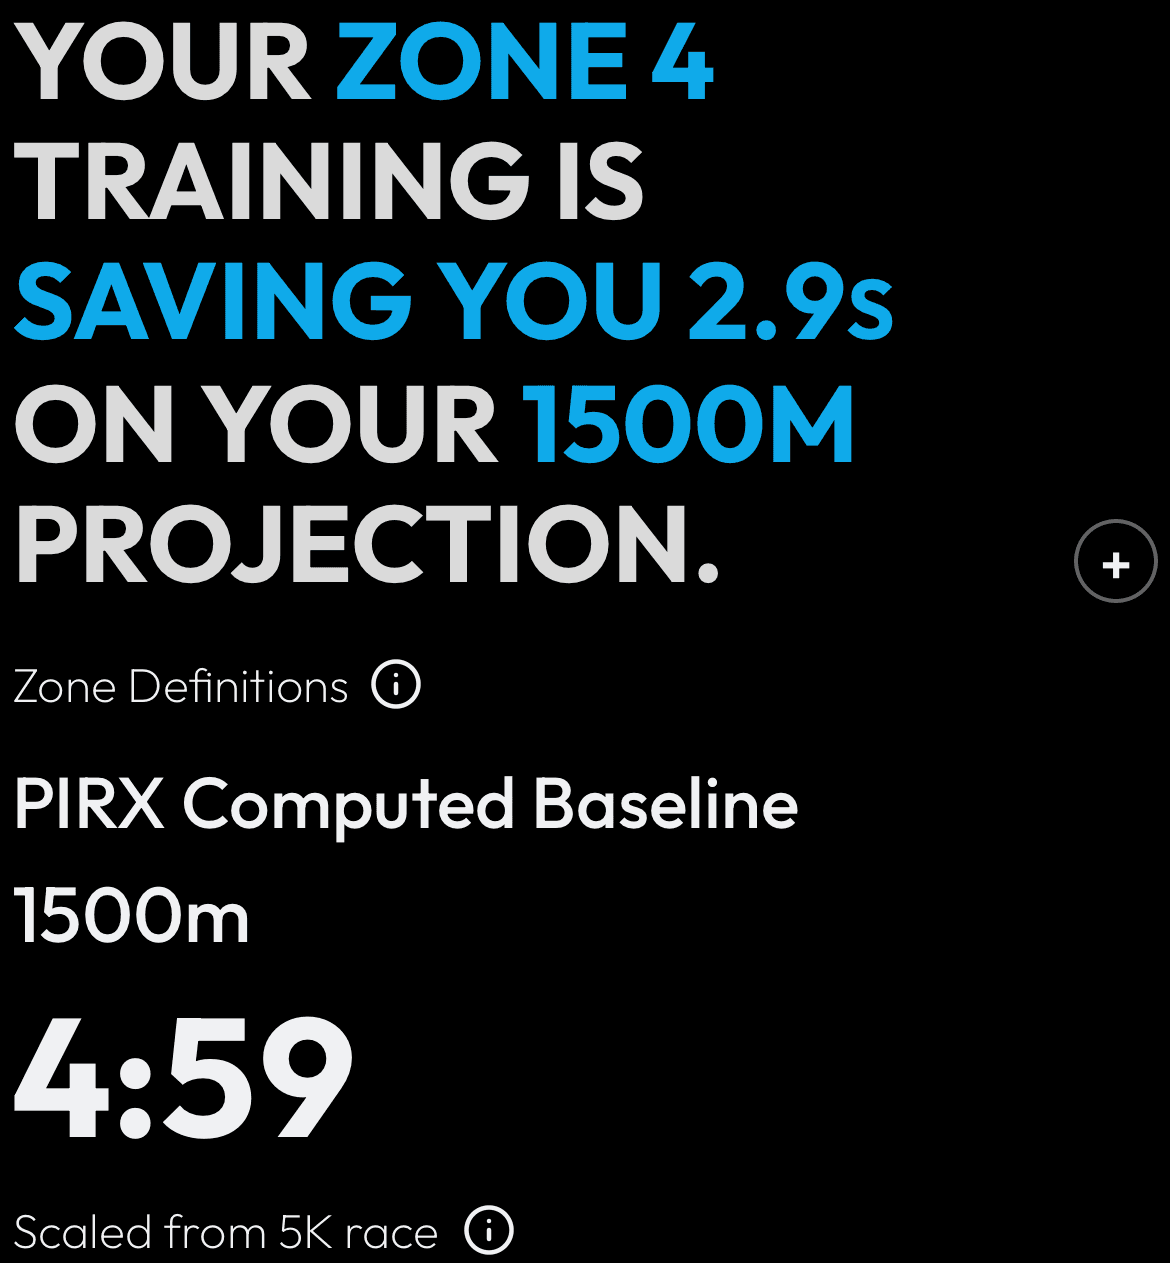
A small card showing your baseline race -- the starting point that all improvement is measured against. It shows the event distance, the time, and the date it was recorded.
How the Numbers Work
When you first set up PIRX, it looks at your race history to find a baseline. If you have no race history, PIRX estimates a starting point using data from similar runners or a default value. All improvement numbers are measured against this baseline.
Step by Step
Models & algorithms used: KNN, LMC, Local Matrix Completion, Riegel
The baseline estimator uses a 5-tier cascade. Tier 1: look for an activity tagged as a race (or where average HR is at least 83 percent of max) at a standard distance, then Riegel-scale it to 5K. Tier 2: look for a sustained effort of 3+ km where HR is at least 85 percent of max, Riegel-scale to 5K. Tier 3: take your fastest-10-percent pace (P10), multiply by 5 km, multiply by 0.96. Tier 4: take your median pace, multiply by 5 km, multiply by 0.80. Tier 5: use 1,500 seconds (25:00) as a safe default. If tagged race results exist across multiple distances, a Local Matrix Completion (LMC) model fills in missing distances using a rank-2 matrix factorization. For brand-new users with almost no data, a KNN cold start (k=3) finds the 3 closest runners in the reference population using normalized Euclidean distance on 5K time and weekly km, then sets the baseline to the mean of those neighbors' 5K times times 1.02. The baseline is stored in your profile and rechecked on each sync.