Event Readiness (Analysis)
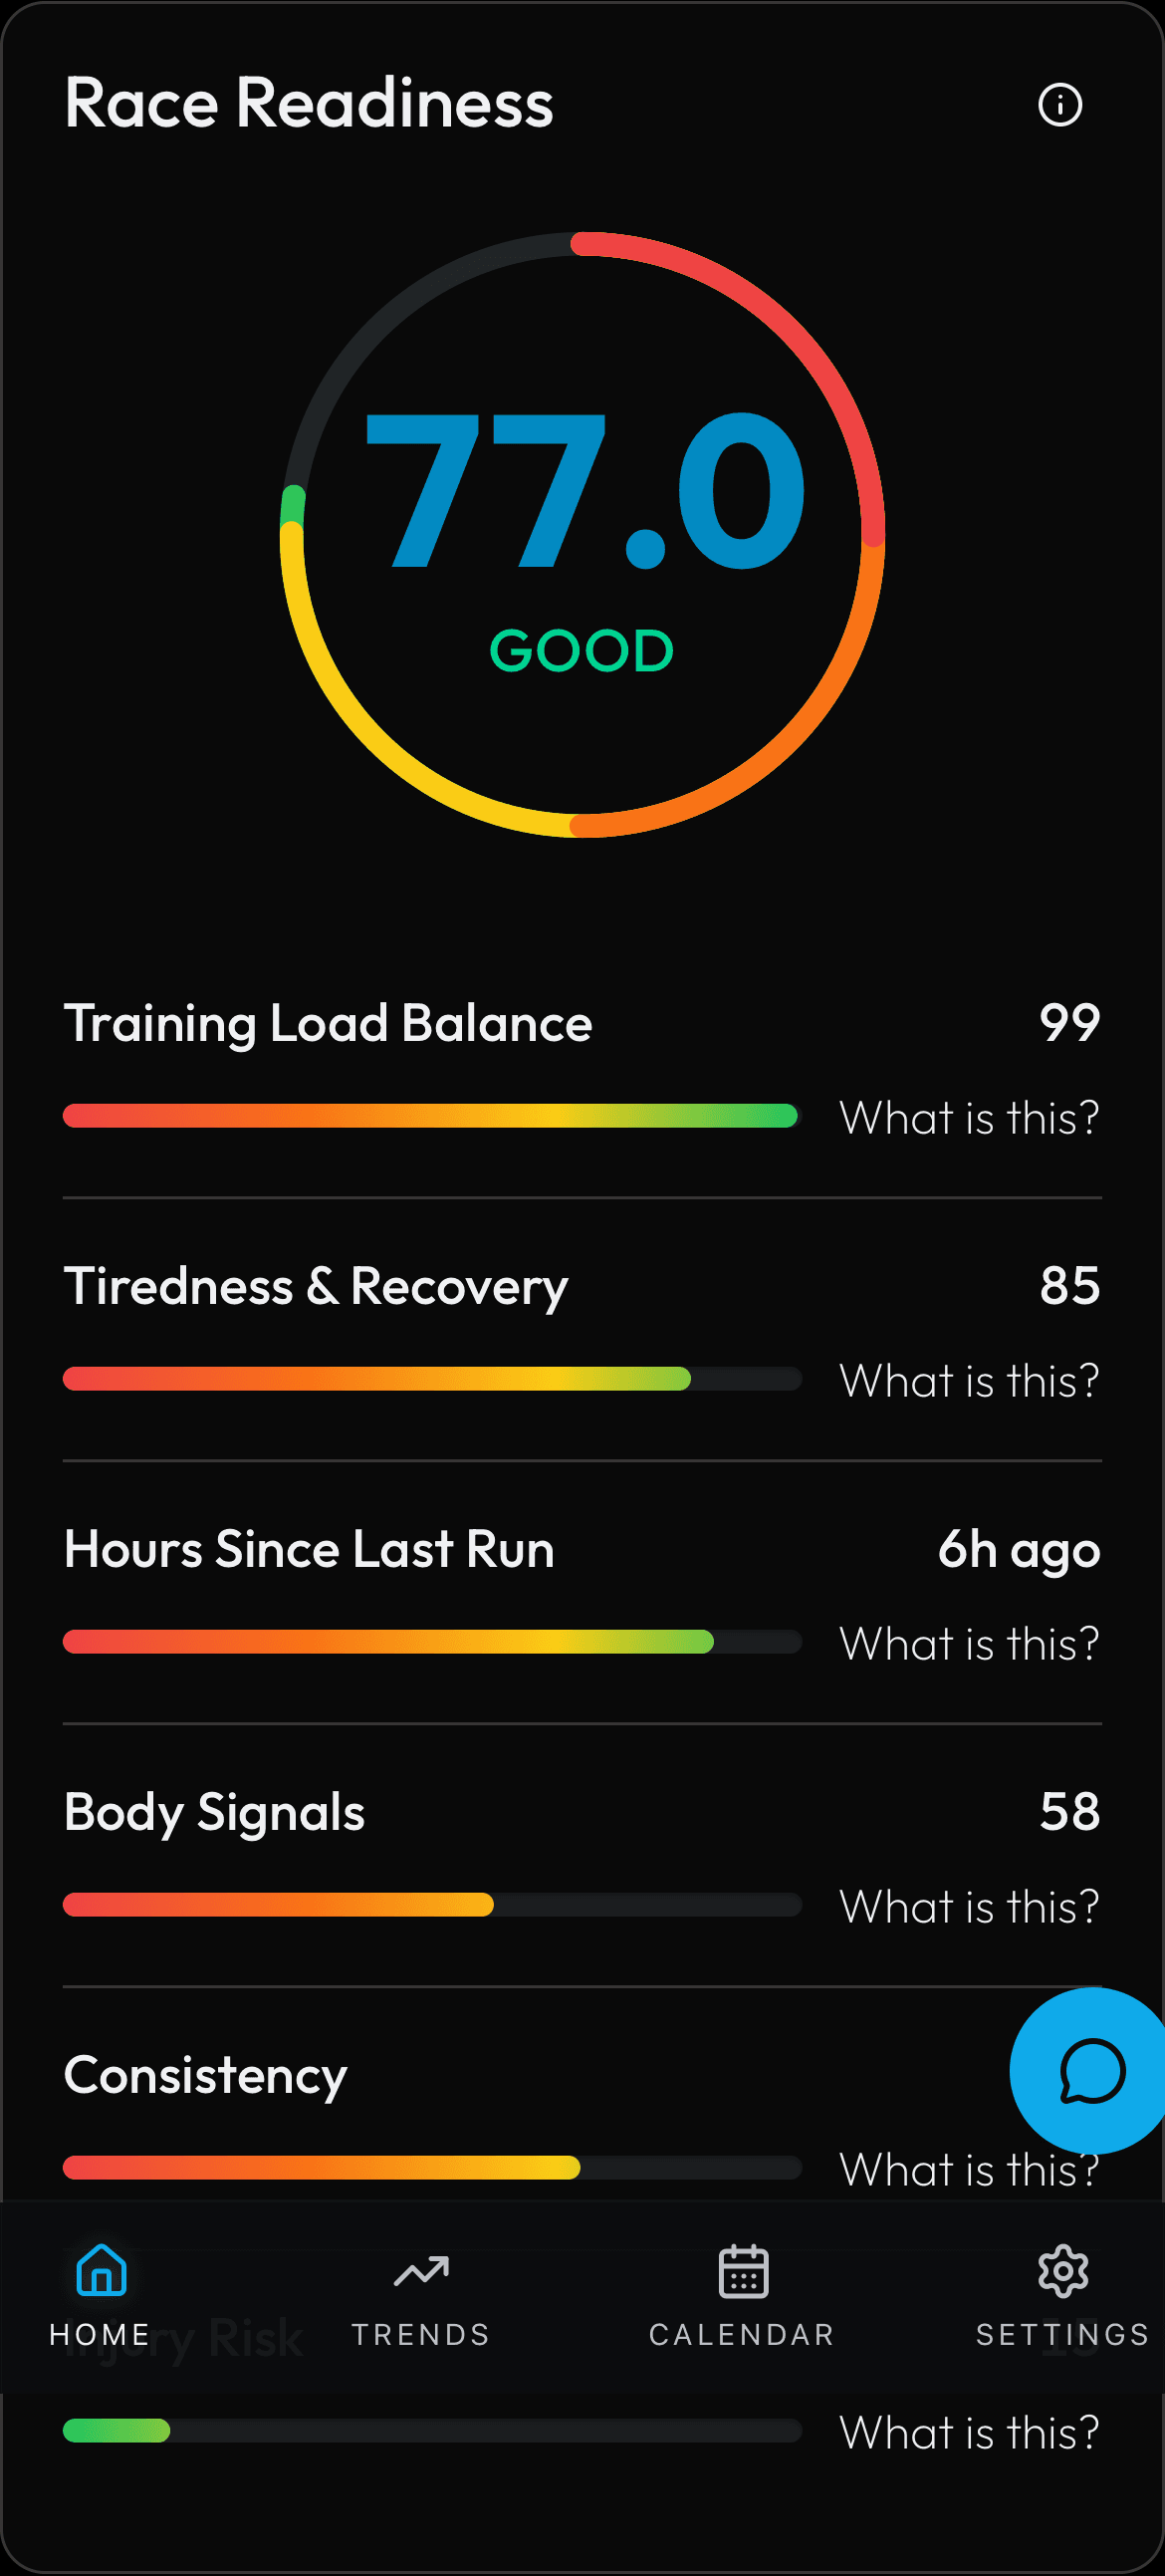
Source: (inline in performance/page.tsx)
What You See
A ring showing your readiness score with a colored label badge (like 'Race Ready' or 'Building'). Below are component breakdown bars showing each sub-score as a progress bar.
How the Numbers Work
Readiness is a weighted combination of training load, consistency, recovery quality, and physiological signals. Each component contributes a portion of the total 0-100 score. Higher scores mean your body is more prepared to race at its best.
Step by Step
Models & algorithms used: Gradient Boosting
Same readiness engine as the dashboard ring (heuristic weighted sum or Gradient Boosting Classifier -- see Readiness Ring). This card shows all sub-components, not just the top 3: ACWR Balance (0.30), Fatigue Freshness (0.25), Training Recency (0.20), Physiological (0.15), and Consistency Bonus (0.10). Each sub-score is rendered as a labeled progress bar scaled to 100. The overall score = sum of (sub-score times weight). The colored label maps score to readiness tier: 80+ = Race Ready, 60-79 = Building, below 60 = Recovering.