Recovery & Body
Source: (inline in dashboard/page.tsx)
What You See
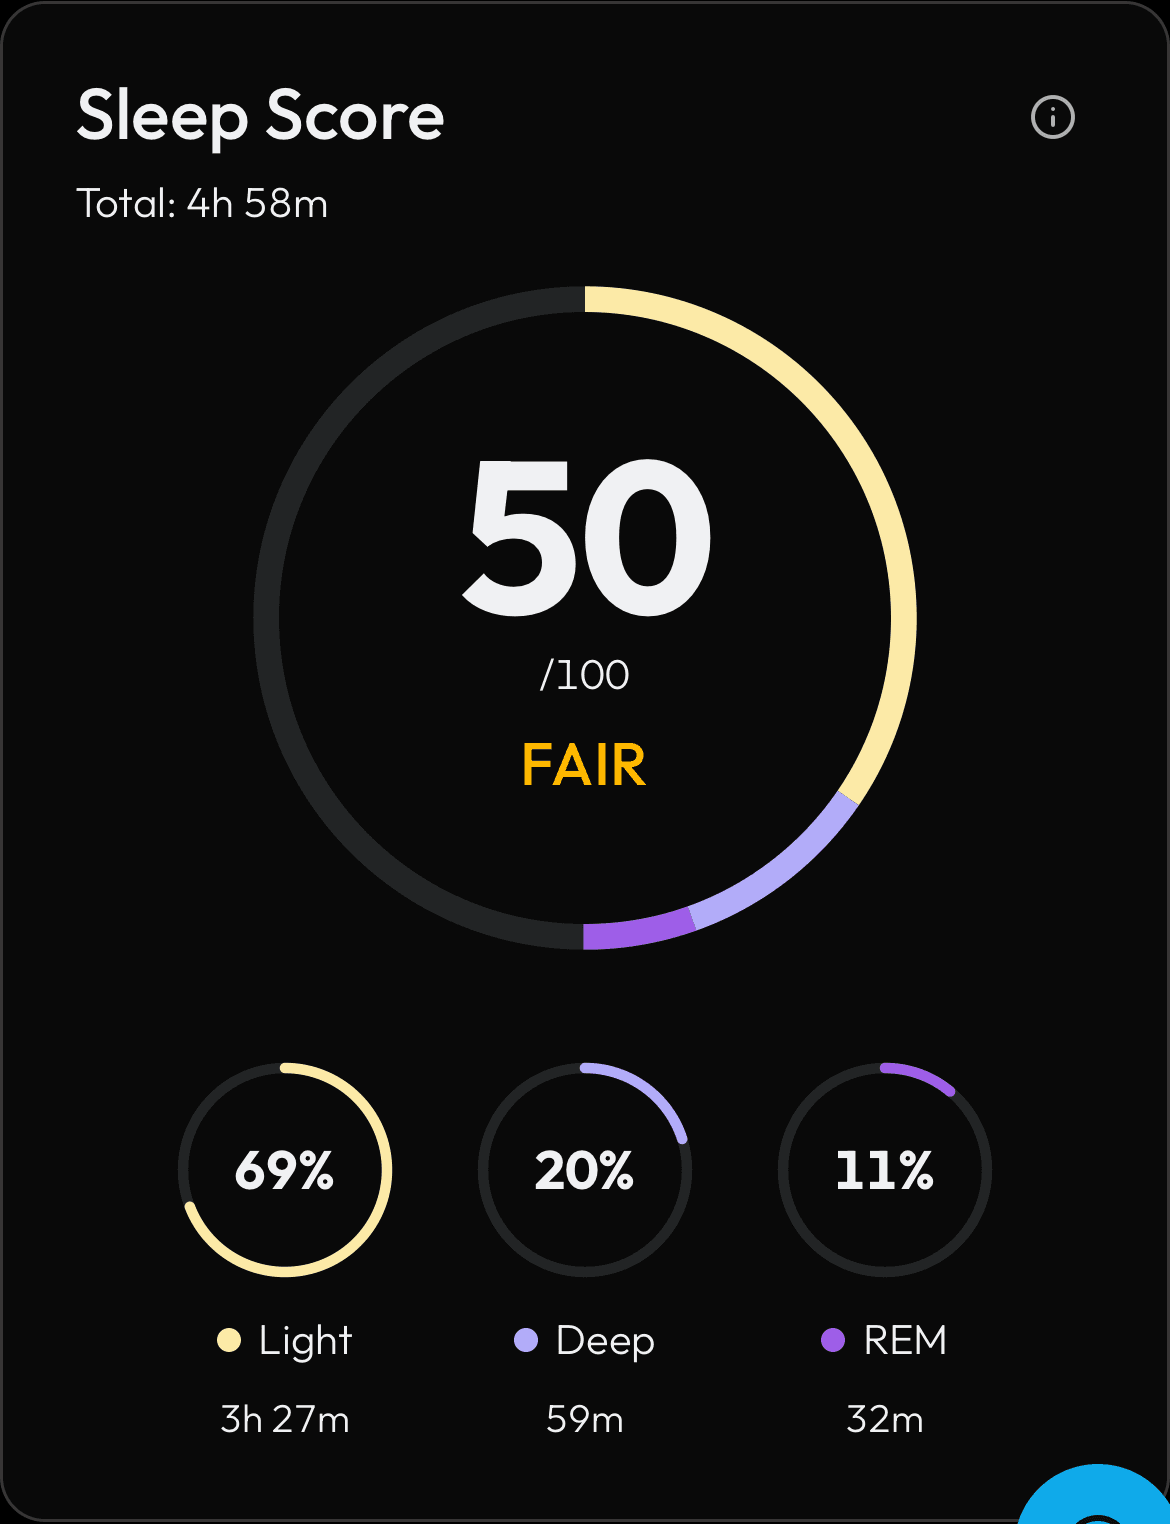
A card with three tiles: Sleep (a score like 82), Weight (in kg), and Body Fat (a percentage). Below those you may see colored pills showing your sleep breakdown: how much time you spent in Deep, Light, and REM sleep. At the bottom, VO2max and Stress level may appear if your wearable provides them.
How the Numbers Work
These numbers come directly from your wearable device. Sleep score is on a 0-100 scale set by your device maker. Weight and body fat come from a smart scale or wearable that tracks body composition. Sleep stages are measured by your watch during the night. VO2max is your body's ability to use oxygen (higher is better). Stress is an average level measured by heart rate patterns.
Step by Step
Terra sends sleep, body, and daily-vitals webhooks whenever your wearable syncs. The backend normalizes each payload using three functions: normalize_sleep_entry maps provider-specific fields (Garmin vs Fitbit vs Apple Health) to a standard schema with sleep_score (0-100), total sleep seconds, and stage durations (deep, light, REM). normalize_body_entry standardizes weight, body fat percentage, and BMI. normalize_daily_entry captures resting HR, HRV, VO2max, and stress level. All values are stored in the physiology table with a UTC timestamp. The dashboard requests the most recent row and renders only the fields that are present.