The Future of Running Analytics: Why Spreadsheets Are Done

On this page
The future of running analytics has already arrived. Race prediction has moved through four clear eras. First came a handwritten notebook. Then a column of formulas on a screen. Then a fixed-formula calculator online. Now a machine-learning engine reads every run you log. It updates your Projected Time after each workout. Each era solved a real problem. Each one also left things out. What it left out is what the next era fixed.
| Era | What it could do | What it could not do |
|---|---|---|
| Handwritten log | Record miles and times by hand | Spot patterns across weeks or predict a race time |
| Spreadsheet | Summarize data and chart weekly mileage | Learn from the data or adapt to your own profile |
| Fixed-formula calculator | Scale one race result to predict another distance | Account for training volume, aerobic base, or your personal fade rate |
| Machine-learning projection (PIRX) | Read your actual runs, learn your profile, and update after every workout | This is where the field is now |
Get your own projection in seconds — free, no signup, no wearable.
Race Time PredictorHow did runners track training before digital tools?
Before GPS, runners used paper. They wrote down miles, time, and how they felt. That log was honest. But seeing a trend took work. A runner had to flip back through weeks of notes. They had to do the math by hand. Most runners only noticed a pattern when something broke down. A coach could read a paper log and spot a warning. Most runners did not have a coach.
The paper log era lasted most of the twentieth century. It gave runners real data to hold. But it could not turn that data into a race guess. To do that, a runner needed another person. Or a better tool.
What did spreadsheets add to runner training?
Spreadsheets came in the 1990s. They let runners store and sort data on their own. A runner could enter every run, add up the weekly total, and see a chart of mileage. That was a step up from a paper notebook.
But a spreadsheet does what you tell it to do. If you write a rule that says your marathon is 4.65 times your best mile, it runs that rule. Every time. For every runner. It does not know if you have been logging easy miles for eight weeks. It does not know if you are skipping long runs. It runs the same rule no matter what.
A spreadsheet stores data. It does not learn from data. That is a big gap.
Why did fixed-formula calculators feel like a step forward?
Fixed-formula calculators hit the web in the late 1990s. You ran a 5K. You typed in your time. The tool gave you a marathon guess in seconds. No coach needed. Every runner could get a number to aim for.
That was real progress. More runners could set a goal time. More runners could build a plan around it.
But the formula behind every one of these tools uses one fixed number. That number scales your short-race speed to a longer distance. It is the same number for a runner who logs 60 miles a week and one who logs 20. It does not know your training. It sees one race time. It fills in the rest with an average built from other runners.
Research from about 25,000 racing seasons found that good marathon prediction needs two personal numbers, not one fixed constant (Kirsch et al., 2020). The second number is how well you hold pace over long runs. That number varies a lot from runner to runner. A fixed formula gives everyone the same value. So it hits some runners by chance. It misses many others by a wide margin.
For a closer look at why the math breaks down, see why static race calculators are often inaccurate.
What data does a modern running watch actually capture?
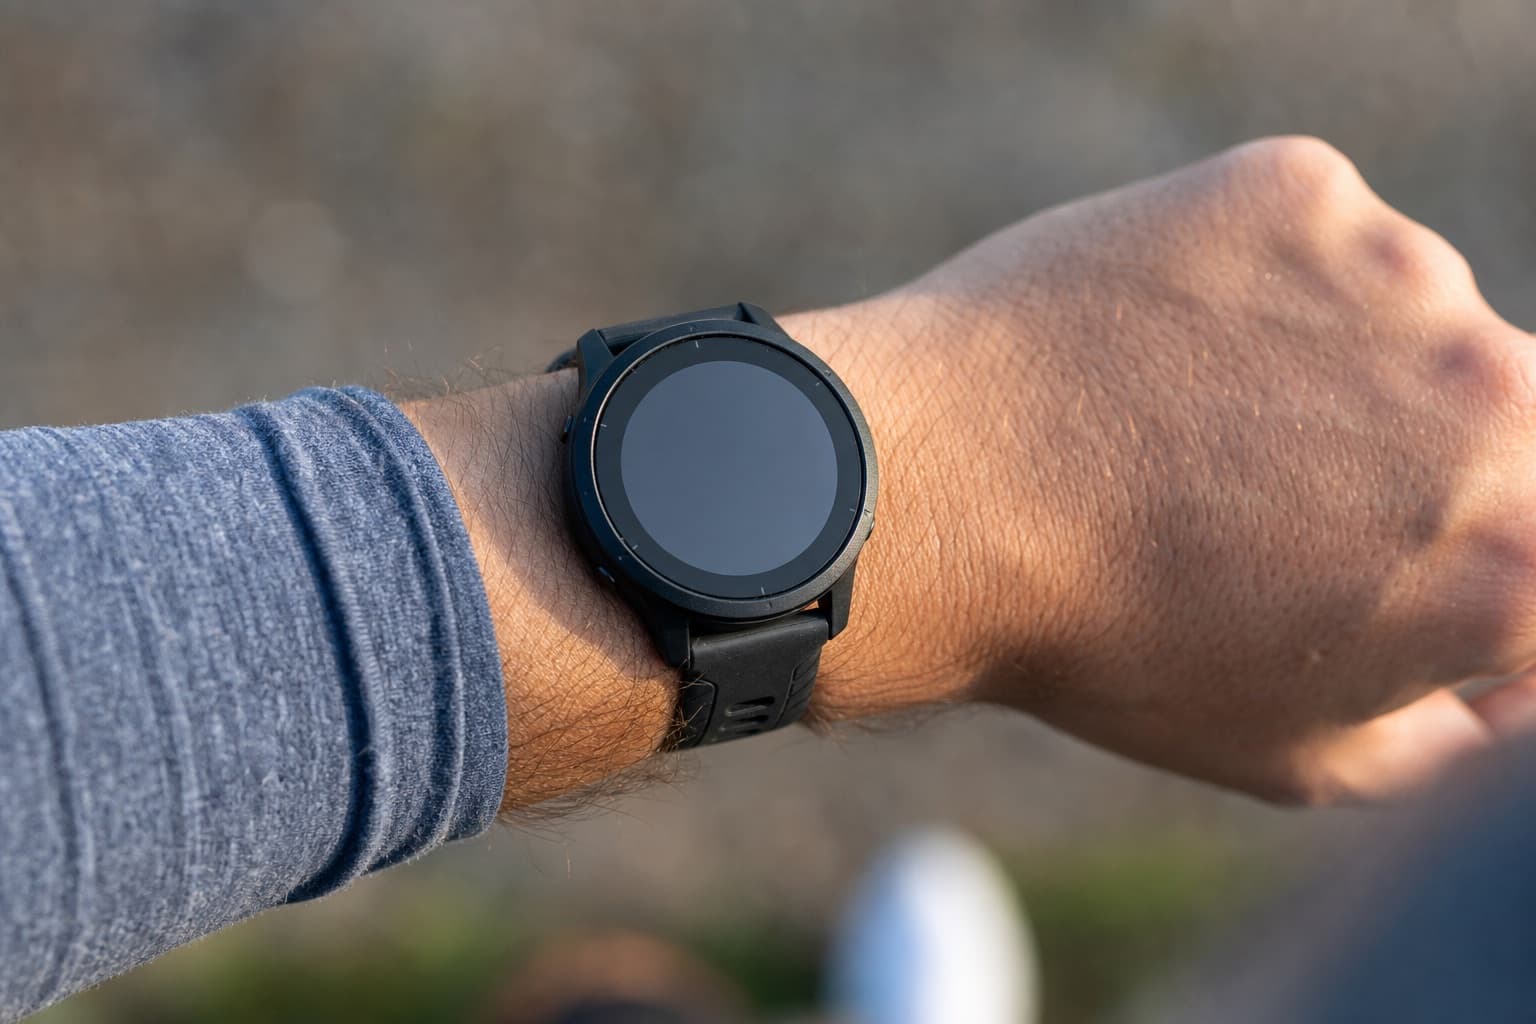
This is where the story changes fast. A running watch from a decade ago recorded time and distance. A modern GPS watch records far more. It logs cadence, stride length, ground contact time, pace by zone, and training load. Many models now track over a dozen metrics per run.
More runners wear these devices than ever. Today, 84% of marathon runners use a wearable for tracking (Business Research Insights, 2026). Over 165 million people run globally. Of those who race, 92.4% use a watch or app to record workouts. The data is there. Hundreds of millions of runs are logged each year.
For the first time, a runner's full training picture is in digital form. Not just one race time. The last twelve weeks of actual work. The question is not whether the data exists. The question is whether the tool reading it is smart enough to use it.
Fixed-formula calculators cannot use any of this. They take one number in. They give one number out. Your full training history sits unused.
- 84%
- of marathon runners now use wearable devices for performance tracking (Business Research Insights, 2026)
Why can machine learning use training data that formulas cannot?
A fixed formula applies one rule to every runner. Machine learning learns a rule for each runner. It reads your actual history. It finds which patterns in your data predict a strong race for you. That is a different idea at its root.
A study of 820 runners tested two AI methods against real marathon times (Lerebourg et al., 2022). The inputs were 10K time, age, sex, and body mass. The best AI model hit an accuracy level above 98%. A second study compared a machine-learning model against the fixed-formula method (Dash, 2024). The AI model reached 90.4% accuracy. The fixed formula reached 80%.
That gap between 80% and 90% sounds small. At the marathon it is not. A 10% error can mean blowing up at mile 20. Machine learning closes that gap. It learns from data. It does not apply one constant to every runner.

What does this mean for race prediction today?
It means we have more data than ever. The tools that matter are the ones that can read it. The future of running analytics is not a faster spreadsheet. It is a model that learns from your training and updates as you improve.
Static calculators were a fair answer for their era. Every runner could get a number in seconds. That was enough when runners had no training data to share. Today, most runners who care about a race goal log every workout. Their watch knows their load. It knows their pace zones. It knows how their cadence has changed. A tool that ignores all of that and applies one formula is not just old. It is giving you a weaker answer on purpose.
"The most useful prediction tools treat each runner as their own case," one sports science researcher put it. Static formulas cannot do that. They were not built to.
What should runners look for in a modern projection tool?
Look for a tool that reads your training history, not just your last race. It should break your fitness into clear parts. It should show you how each part shapes your race time. It should update as your training changes. And it should show a range of likely finish times, not just one number.
The Supported Range matters. No honest tool can promise one exact finish time. Race day involves things no model can fully see. A good tool shows the band you can realistically target. That is more useful than a single number built the same way for every runner.
To see why built-in watch predictions fall short, read why smartwatch race predictions are often wrong.
Why PIRX is built for the next era of running analytics
PIRX does not use a fixed formula. It is a proprietary machine-learning prediction engine. It reads your connected Garmin, COROS, or Strava history. It learns your own profile. It breaks your fitness into five drivers: Aerobic Base, Threshold Density, Speed Exposure, Load Consistency, and Running Economy. Each driver is scored from 0 to 100. The gains from each one add up to your total time change, in seconds.
Your Projected Time comes from your own data. Not the average of all runners. Not a constant set long ago. Your actual training, your pacing patterns, and your load over recent weeks.
PIRX also gives you a Supported Range. That is the honest band of likely finish times based on your profile. PIRX recalculates after every synced activity. A visible change shows only when the shift in your fitness is real and large. If your Aerobic Base grows, your projection shifts. If you drop training for two weeks, that shows too.
For a full look at how projection tools have moved past simple calculators, read the complete guide to predicting your race time. To compare PIRX against Strava and Garmin's built-in estimates, see Strava and Garmin vs PIRX.
- 98%
- validated prediction accuracy (PIRX users)
Get a projection built on your training, not a formula
Stop guessing what your training is worth. A one-size-fits-all calculator applies one formula to every runner. It does not know your base. It does not know your history. Connect your Garmin, COROS, or Strava to PIRX in under 30 seconds. See your five drivers. See where your seconds come from. Get a race-time projection built on your data. Free, no signup.
Get your own projection in seconds — free, no signup, no wearable.
Race Time PredictorSources
- Kirsch, P. et al. (2020). Human running performance from real-world big data. Nature Communications, 11:4936. (Accurate marathon prediction needs two personal numbers, not one fixed constant; data from about 25,000 racing seasons shows endurance numbers vary widely between runners.)
- Lerebourg, L. et al. (2022). Prediction of marathon performance using artificial intelligence. International Journal of Sports Medicine. (K-nearest neighbor AI model reaches accuracy above 98% predicting marathon time from 820 runners; both AI methods outperform static formulas.)
- Dash, S. (2024). Win your race goal: a generalized approach to prediction of running performance. International Journal of Sports Medicine. (Machine-learning model reaches 90.4% accuracy vs 80% for the fixed-formula baseline.)
- Business Research Insights (2026). Running Watches Market Size, Share, Growth, Trends. (More than 165 million people run globally; 84% of marathon runners use wearable devices; 92.4% use digital tracking tools.)
Already know your number? Start your 14-day free trial