What's a Good 5K Time by Age?

On this page
A good 5K time depends on your age and your gender. For a man in his 20s or 30s, a good 5K is around 22 to 23 minutes. For a woman in the same range, it is around 26 minutes. The average across all finishers is much slower, near 34 minutes for men and 40 minutes for women. Good means clearly above average. It does not mean elite.
| Age group | Average woman | Good woman | Average man | Good man |
|---|---|---|---|---|
| Under 20 | 38:38 | 27:26 | 31:28 | 23:19 |
| 20 to 29 | 38:44 | 26:07 | 33:19 | 22:31 |
| 30 to 39 | 40:13 | 26:17 | 34:36 | 22:53 |
| 40 to 49 | 41:40 | 27:47 | 35:24 | 24:38 |
| 50 to 59 | 43:57 | 30:54 | 36:34 | 26:40 |
| 60 and over | 48:41 | 34:54 | 40:42 | 29:05 |
Get your own projection in seconds — free, no signup, no wearable.
5K Time PredictorWhat is a good 5K time by age?
A good 5K time is one that is clearly faster than most runners your age and gender. For a man in his 20s, a good 5K is about 22:31. For a man in his 30s, it is about 22:53. For a woman in her 20s, a good 5K is about 26:07, and about 26:17 in her 30s. These come from Running Level's above-average standard (Running Level, 2024).
The target gets slower as you age. A good 5K for a man in his 50s is about 26:40. For a woman in her 50s, it is about 30:54. By age 60 and over, a good time is about 29:05 for men and 34:54 for women. These are not elite times. They are the times a steady, committed runner can reach.
The key word is good, not best. Good sits above the crowd but below the front of the race. It is a target most healthy runners can hit with one to two years of regular training. The world record sits far beyond this. The 5K road record is 12:49 for men and 14:13 for women (World Athletics, 2024). Good is a personal goal, not a podium.
What is the average 5K time?
The average 5K time is about 34 minutes for men and 40 minutes for women. This comes from 2018 race results compiled by the IAAF and RunRepeat (RunRepeat, 2019). The average climbs with age. Men in their 20s average 33:19. Men in their 40s average 35:24. Men over 60 average 40:42. Women in their 20s average 38:44, rising to 48:41 by age 60 and over.
- 34:36
- average 5K time for men in their 30s (IAAF and RunRepeat, 2018)
The average looks slow to many runners. That is because it includes every single finisher. First-timers, walkers, parents pushing strollers, and charity walkers all count. The 5K is the most popular race distance in the United States. Nearly 9 million people finish one each year (RunRepeat, 2019). A huge share of them are not training runners. They are people out for a fun morning.
So the average is a low bar. If you train at all, you will likely beat it. The good column in the table above is a far better target for a runner who wants to improve. The gap between average and good is the gap between showing up and training with a plan.
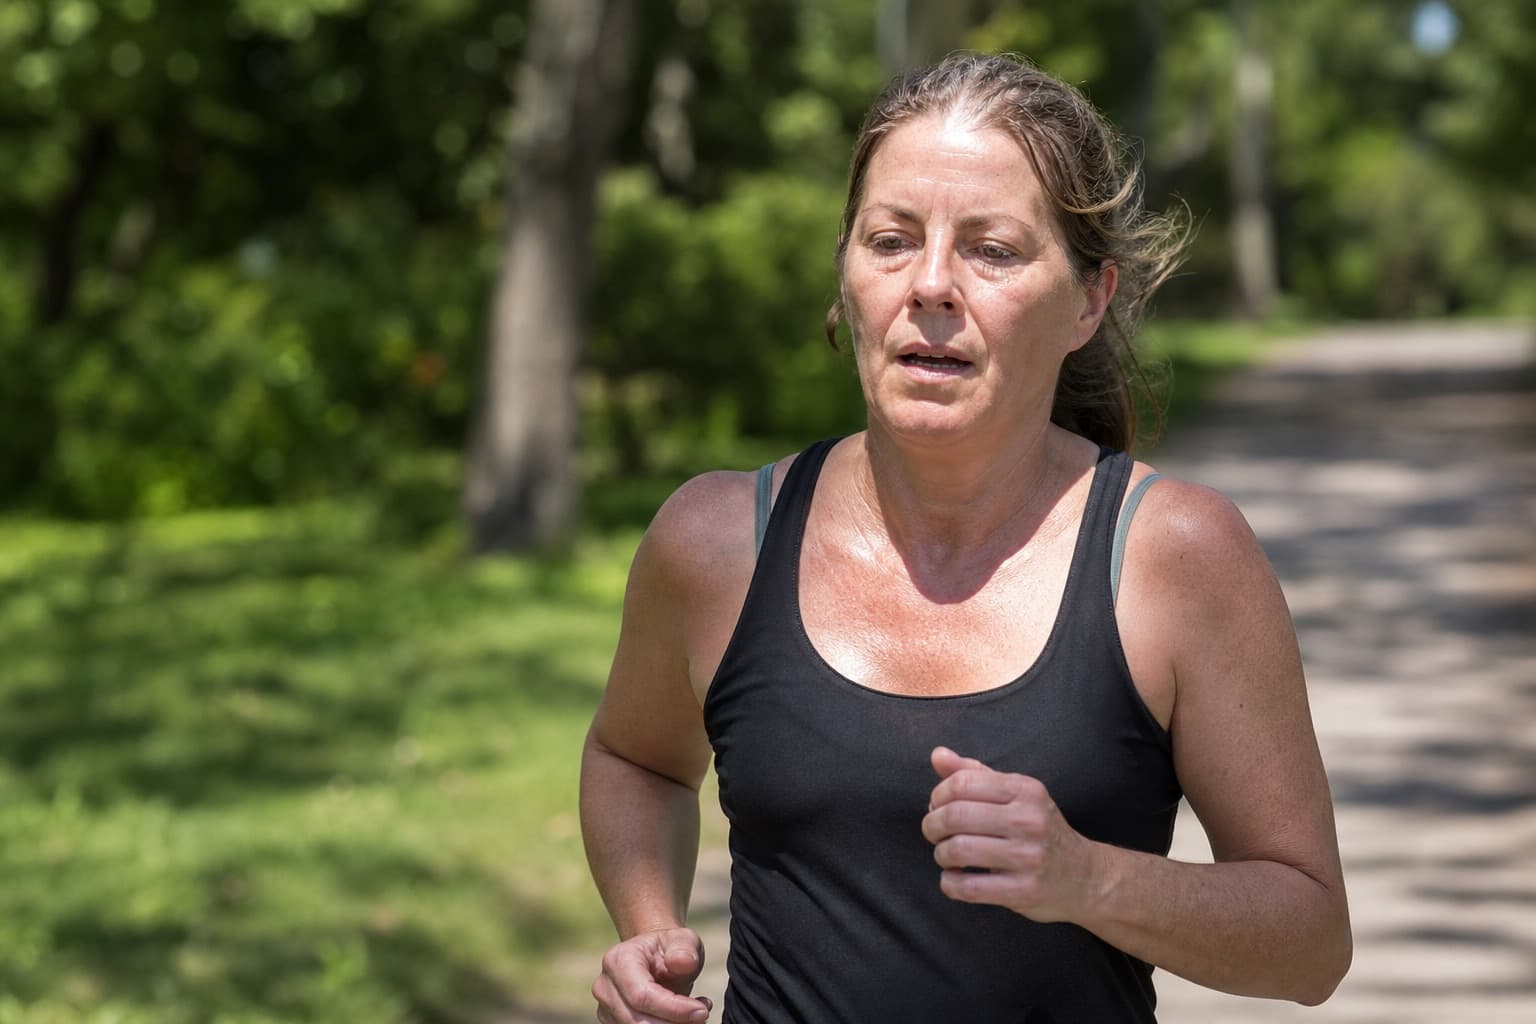
Why is a good 5K time slower as you get older?
A good 5K time slows with age because your body changes. Your heart pumps a little less blood with each beat. Your muscles lose some fast fibers. Your top aerobic power drops. All of this is normal. None of it stops you from running well.
The decline is slow at first. Peak endurance performance holds until about age 35. After that, it falls in small steps until age 50 to 60. Then the drop gets steeper (Tanaka and Seals, 2008). This is why a good 5K for a 30-year-old man, near 23 minutes, becomes near 27 minutes by age 55. The runner did not get lazy. The body changed.
- 35
- age until which peak endurance performance is maintained (Tanaka and Seals, 2008)
This is the whole point of judging your 5K by age. A 27-minute 5K is a good time for a man in his late 50s. The same time is just above average for a man in his 20s. The clock means nothing without your age next to it. A good masters runner can be just as fit, for their age, as a fast young runner is for theirs.
What makes the 5K different from longer races?
The 5K is a speed race more than a patience race. It is short and fast. Most runners finish in 20 to 45 minutes. At that pace, you run close to your top aerobic power for the whole way. A 5K asks for a higher fraction of your maximal effort than a 10K or a half marathon does (Gastin, 2001).
This shapes what a good 5K needs. The longer races reward a deep base and patience. The 5K rewards your top-end engine and your willingness to hurt. You feel it in the legs and the lungs the entire time. There is no easy first half. This is why the 5K is the best test of raw running speed for everyday runners.
The 5K also has a culture all its own. Parkrun puts on free, timed 5K events every Saturday across the world. It pulls in true beginners and club racers to the same start line. That is why the spread of times is so wide. The same race holds a 19-minute club runner and a 45-minute first-timer. Both are doing the exact same distance. The 5K welcomes everyone, then quietly sorts them by speed.

Average vs good: what does "good" really mean?
Good means above average, but the smarter measure is age grading. Age grading takes your time, your age, and your gender, and compares them to the world record for that exact group. The result is a percentage. A score above 60 percent is locally competitive. Above 70 percent is regionally strong. Above 80 percent is national class (Running Level, 2024).
This is why a flat time chart only tells half the story. A 26-minute 5K from a 58-year-old woman can age-grade higher than a 22-minute 5K from a 25-year-old man. The older runner is closer to her age's ceiling. Age grading lets any two runners compare fairly, no matter their age or gender. Most parkrun results show this score for you.
So good is not one number. It is a moving target set by who you are. The table above gives you a solid starting point. Age grading sharpens it. But neither one tells you your own true ceiling. That takes a look at your actual training, not just a chart row.
How fast can a beginner expect to run a 5K?
A new runner often finishes a first 5K in 30 to 40 minutes. Many walk part of it and finish closer to 45 minutes. That is normal and fine. The average pace across all finishers works out to about 7:04 per kilometer for men and 8:18 per kilometer for women (RunRepeat, 2019). A brand-new runner usually starts on the slower side of that.
The good news is that beginners improve the fastest. The first one to two years of steady training bring the biggest drops. It is common to take five or more minutes off a 5K in a single year of regular running. From there, the path is clear. Many runners chase round-number goals as they get fitter, like a sub-30 5K, then a sub-25 5K, and for the well-trained, a sub-20 5K.
Each goal is a real jump in fitness. Going from 30 to 25 minutes means running a full minute faster per kilometer. That is not luck. It is built from the right mix of easy miles and fast work. The 5K rewards both. You need an engine and you need a sharp top gear.
Why your age and gender are only the start
A chart can tell you the average for your age. It cannot tell you what you are capable of. Two runners the same age and gender, with the same 5K time today, can have very different ceilings. One may be near their limit. The other may have minutes to spare. A static row in a table treats them as the same. They are not.
PIRX is a proprietary machine-learning prediction engine. It does not guess from your age and gender alone. It reads your real runs. It scores the parts of your fitness that set your 5K, like your Aerobic Base, your Speed Exposure, and your Running Economy. For the 5K, Speed Exposure carries extra weight, because the race lives near your top end. Each driver shows the gain in seconds it can add.
PIRX gives you a Projected Time, not a population average. It comes with a Supported Range that shows the spread of likely finishes given your current fitness. The projection recalculates after every synced activity. A visible change shows only when the structural change is at least 2 seconds, so you see real progress and not random noise. If you want the full picture of how this works, read our complete guide to predicting your race time.
- 98%
- validated prediction accuracy (PIRX users)
See your real 5K ceiling
Stop comparing yourself to a chart row. A chart shows the crowd. It cannot show your potential. PIRX can. Connect your Garmin, COROS, or Strava in under a minute. See your Projected 5K Time, your Supported Range, and the drivers that hold you back. Then watch the number drop as you train the right gaps. Free, no signup needed.
Get your own projection in seconds — free, no signup, no wearable.
5K Time PredictorSources
- RunRepeat & IAAF (2019). The US 5K Stats Page. (2018 average 5K finish times by age and sex, compiled from US race results.)
- RunRepeat (2019). The State of Running. (Large-scale analysis of race results; 5K participation and average pace by gender.)
- Running Level (2024). 5K Run Times By Age And Ability. (Above-average and ability-level 5K standards by age and gender, plus age-grading bands.)
- Tanaka, H. & Seals, D.R. (2008). Endurance exercise performance in Masters athletes: age-associated changes and underlying physiological mechanisms. Journal of Physiology. (Peak endurance performance is maintained until about age 35, then declines, with steeper losses after 50 to 60.)
- Gastin, P.B. (2001). Energy System Interaction and Relative Contribution During Maximal Exercise. Sports Medicine, 31(10), 725-741. (Shorter races such as the 5K demand a higher fraction of maximal aerobic power than longer races.)
- World Athletics (2024). 5 Kilometres Road Running Records. (Current 5K road world records: 12:49 men, 14:13 women.)
Already know your number? Start your 14-day free trial