How to Run a Sub-1:30 Half Marathon

On this page
A sub-1:30 half marathon means holding 4:16 per kilometer, or 6:52 per mile, for the full 21.1 km. Held even, that is 21:20 at 5 km, 42:39 at 10 km, and 1:25:18 at 20 km. This is a fast, steady pace, not a jog. The wall is your lactate threshold. Sub-90-minute half marathon training is built to lift that ceiling. It helps you hold the pace for 13.1 miles. And it stands on a real mileage floor.
| Marker | Even-pace time | Pace or note |
|---|---|---|
| Per kilometer | 4:16 | the goal pace |
| Per mile | 6:52 | the goal pace |
| 5 km split | 21:20 | 4:16/km |
| 10 km split | 42:39 | 4:16/km |
| 15 km split | 1:03:59 | 4:16/km |
| 20 km split | 1:25:18 | 4:16/km |
| Finish (21.1 km) | 1:29:59 | 4:16/km |
| Weekly mileage floor | 64 to 80 km | about 40 to 50 miles, the tier most sub-90 runners train in |
Get your own projection in seconds — free, no signup, no wearable.
Half Marathon Time PredictorWhat pace is a sub-1:30 half marathon?
A sub-1:30 half marathon is 4:16 per kilometer, or 6:52 per mile. The half marathon is 21.0975 km long. To finish in 1:29:59, you cover each kilometer in 4 minutes and 16 seconds. That pace holds for all 21.1 km.
Here is the math in plain terms. One hour, 29 minutes, and 59 seconds is 5,399 seconds. Divide that by 21.0975 km. You get about 256 seconds per kilometer. That is 4:16 per km. In miles, the race is 13.1 miles. Each mile takes about 6:52.
This pace is not a jog. It is fast and steady at once. The first few kilometers feel easy. That is the trap. The pace bites later. Your job is to make 4:16 feel easy deep into the race. That takes a high ceiling and a deep tank, not just fresh legs.
How hard is a sub-90-minute half marathon?
A sub-90-minute half marathon is a fast time that few runners reach. It is well past the middle of the pack. It sits in the range where a runner is fast, light, and well trained. It is not where most finishers land.
The research backs this up. One study looked at 134 everyday half-marathon runners. Only the fastest fifth ran in the 73 to 92 minute range (Nikolaidis & Knechtle, 2023). The slower groups ran 100 minutes or more. And the fast group did not get there by luck. They were lighter. They ran the most miles each week of any group.
- Top 20%
- of runners in one study ran a half in the sub-90 range (Nikolaidis & Knechtle, 2023)
So a sub-90 half is a real reach for most runners. But it is not out of reach. A keen runner can hit it over a focused block. You need the right pace at your threshold. You need enough weekly miles. You need long runs with quality inside them. The rest of this guide covers each piece.
What raises your sub-1:30 ceiling?
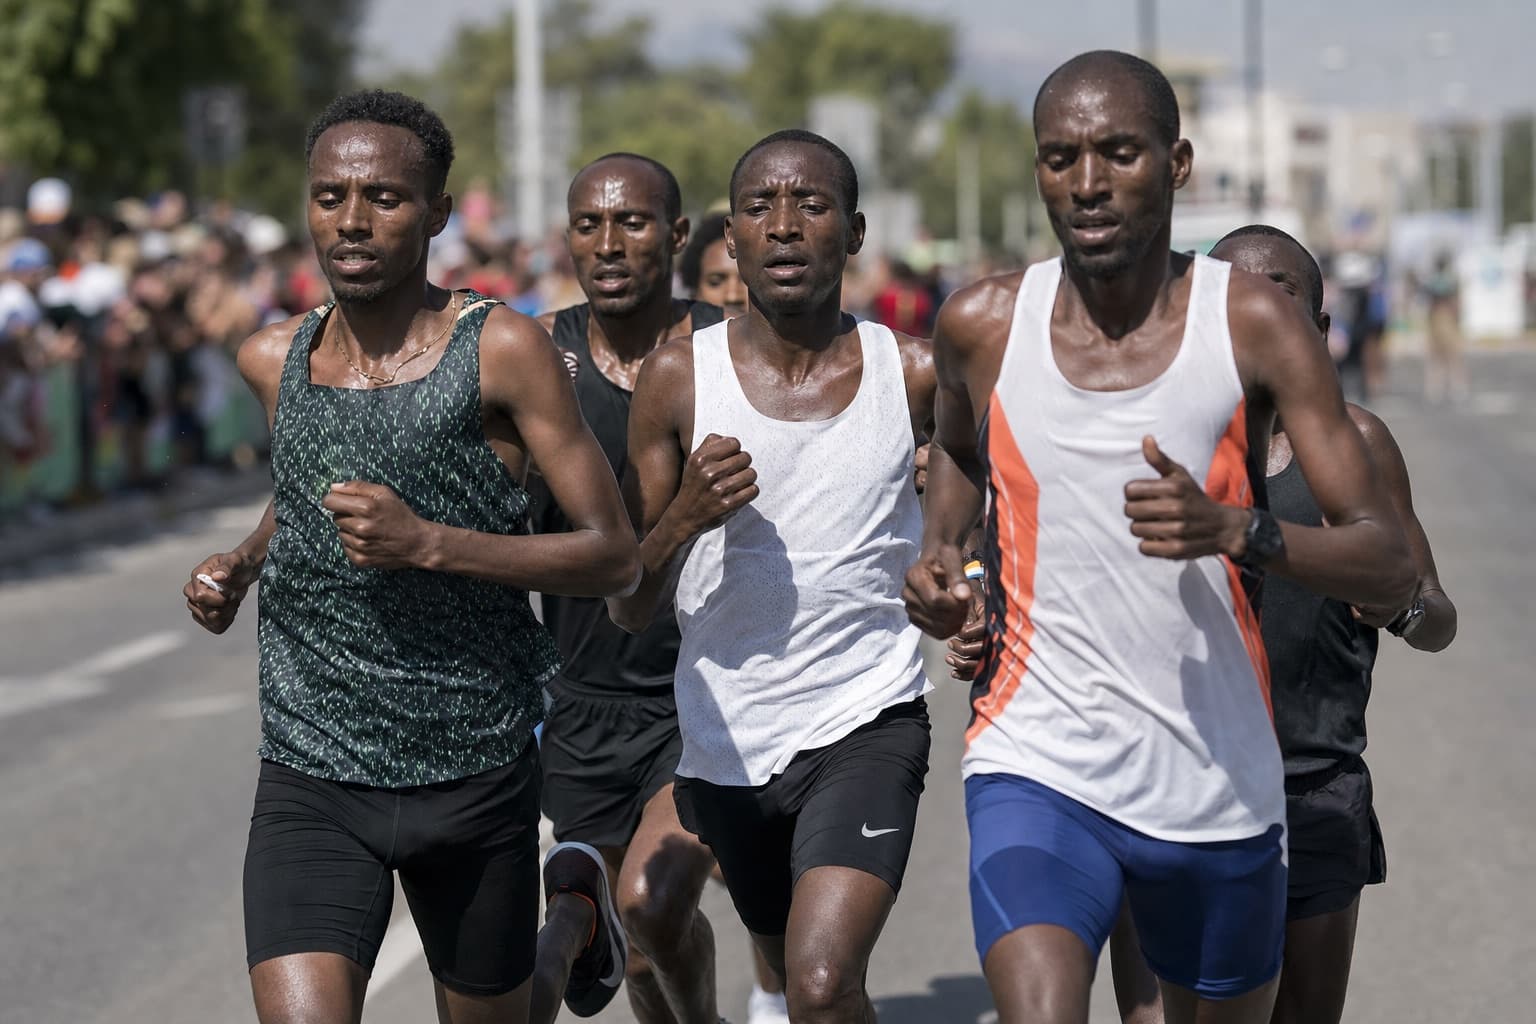
Your lactate threshold sets your sub-1:30 ceiling. The lactate threshold is the fastest pace you can hold before waste builds up faster than your body clears it. Past that pace, you slow down fast. A sub-90 half is run right at this line for 21.1 km. Lift the line, and 4:16 stops feeling like a fight.
This is the clearest signal in the data. One study looked at about 14,000 runners. It found that your speed at the lactate threshold is the best single marker of distance running form (Emig & Peltonen, 2020). Not your top sprint speed. Not a watch number. The pace you can hold near your threshold is what sets your finish time.
- ~14,000
- runners analyzed; lactate threshold speed was the best marker of distance performance (Emig & Peltonen, 2020)
To raise that pace, you train near it. In PIRX terms, this builds your Threshold Density. That driver most directly sets your half marathon pace. The work is one hard, steady session each week. Run for 20 to 40 minutes at a pace you could just barely hold for an hour. It should feel hard but not all-out. You can say one word, but not a full sentence.
Quality matters more as you get fit. A review of trained runners looked at how they split their effort. A mix that was mostly easy, with a few sharp hard days, raised aerobic power the most (Silva Oliveira, Boppre & Fonseca, 2024). Easy miles alone will not lift your ceiling. You need the hard edge too.
How much weekly mileage does a sub-1:30 half really need?
A sub-1:30 half needs a real mileage floor, usually about 64 to 80 km a week, or 40 to 50 miles. This is the part many runners skip. You cannot hold 4:16 for 21.1 km on three short runs a week. The volume builds the engine that lets the pace feel easy.
The data is clear here too. Weekly running distance was strongly tied to half marathon time. More miles meant faster races (Nikolaidis & Knechtle, 2023). In that study, the whole group ran about 53 km a week. The fastest runners, the ones near sub-90, trained well above that.
But more is not always better. Past a point, extra miles add fatigue and injury risk faster than fitness. The goal is a steady floor, held week after week. It is not one huge week and then a sore knee. Add miles by no more than 10 percent a week. Take an easy week every fourth week. Raw mileage is a tool, not a trophy. To see why the biggest week is the wrong target, read why peak mileage will not save your half marathon.
So treat 64 to 80 km a week as the platform. The threshold work and the long runs sit on top of it. Without the platform, the quality work has nothing to stand on.

How sharp do your long runs need to be?
Your long runs need goal-pace quality inside them, not just easy distance. This is what splits a sub-90 plan from an easier one. A slower runner can build a half on easy miles alone. A sub-90 runner has to teach the body to hold 4:16 when tired.
Here is how. Most of your long run stays easy. But late in some long runs, add a fast block. Run the last 5 to 8 km at 4:16, or close to it, on tired legs. This trains the exact skill the race asks for. You learn to run fast when you are worn down. A flat easy long run does not build that skill.
Endurance counts for more than most runners think. The big-data study found that a runner could cut their finish time by a lot through endurance alone, with no change in their top engine (Emig & Peltonen, 2020). Endurance is the ability to hold a high share of your pace late. Sharp long runs are how you build it.
Keep the easy parts truly easy. The quality block at the end is the point, not the whole run. For how to set your easy long-run effort, read what pace to run your long runs.
Does running economy matter at 4:16 per km?
Yes, running economy matters a lot at this pace. Running economy is how much fuel your body burns to hold a set speed. A leaner runner uses less energy at 4:16 per km. That saved energy shows up in the final kilometers, when the race is won or lost.
This is well known. A review of trained distance runners found a strong link between running economy and race results (Saunders et al., 2004). Among runners with a similar top engine, economy was the better sign of who ran faster. Two runners with the same fitness can finish minutes apart. The leaner one wins.
Economy rises quietly. It grows as you log steady miles over months. It also grows with strides, light speed work, and good form. You do not chase it head-on. You build it as a side effect of steady training. That is one more reason the mileage floor matters. It grows your economy while it grows your engine.
Why does PIRX beat a one-size-fits-all calculator?
A one-size-fits-all calculator takes one race time and gives one number back. It cannot see your threshold work. It cannot see your weekly volume. It cannot tell you if 4:16 will hold for 21.1 km or fall apart at 15 km. It treats every runner the same. Two runners with the same 10K time get the same half estimate, even when one has a deep base and the other has none.
PIRX is different. It is a proprietary machine-learning prediction engine. It reads your actual synced runs, not one race result. It breaks your fitness into five drivers: Aerobic Base, Threshold Density, Speed Exposure, Load Consistency, and Running Economy. For a sub-90 half, your Threshold Density and Aerobic Base carry the most weight. The engine scores each one and shows where your seconds come from, in real seconds, not percentages.
Then it gives you a Projected Time with a Supported Range. The Supported Range is the band your real finish should land in. If sub-1:30 sits inside that range, the goal fits your current data. If it sits outside, you know how much work is left. PIRX recalculates after every synced activity. A visible change in your Projected Time shows only when the structural change is at least 2 seconds, so you see real progress, not noise.
- 98%
- validated prediction accuracy (PIRX users)
And if sub-90 is a stretch this season, see the steadier path in how to run a sub-2-hour half marathon.
Is sub-1:30 inside your Supported Range?
Stop guessing what your training is worth. Do not rely on generic watch algorithms that treat every runner the same. Connect your Garmin, COROS, or Strava to PIRX in under a minute. See your five drivers. Check your Threshold Density and your Aerobic Base. Then get a Projected Time for your half, with a Supported Range built from your own runs. See if sub-1:30 is already inside your range, or how many weeks of work it will take to get there. It is free, with no signup needed.
Get your own projection in seconds — free, no signup, no wearable.
Half Marathon Time PredictorSources
- Emig, T. & Peltonen, J. (2020). Human running performance from real-world big data. Nature Communications, 11, 4936. (Analysis of about 14,000 runners; running velocity at the lactate threshold is the best physiological predictor of distance performance, faster runners pace more evenly, and endurance is highly sensitive to finish time.)
- Nikolaidis, P.T. & Knechtle, B. (2023). Predictors of half-marathon performance in male recreational athletes. EXCLI Journal, 22, 559-566. (In 134 recreational runners, weekly running distance was strongly related to half-marathon time; the fastest fifth ran 73 to 92 minutes and trained the most.)
- Saunders, P.U. et al. (2004). Factors affecting running economy in trained distance runners. Sports Medicine, 34(7), 465-485. (Running economy is strongly associated with distance performance and predicts performance better than top aerobic capacity among runners of similar ability.)
- Silva Oliveira, P., Boppre, G. & Fonseca, H. (2024). Comparison of polarized versus other types of endurance training intensity distribution on athletes' endurance performance. Sports Medicine, 54. (A polarized intensity mix, mostly easy with sharp hard sessions, improved aerobic power more than other mixes, especially in highly trained athletes.)
Already know your number? Start your 14-day free trial