Average Marathon Time by Age and Gender

On this page
The average marathon time shifts with both age and gender, but the clearest split is gender, and the whole field has slowed by 40 minutes since 1986. The median marathon time is about 4 hours 14 minutes for men and 4 hours 42 minutes for women. The middle runner across everyone finishes in 4 hours 26 minutes 33 seconds. That number is slow because it counts every finisher, not just trained racers.
| Percentile | Men | Women | All runners |
|---|---|---|---|
| Top 10% (10th) | 3:22:40 | 3:49:22 | 3:31:46 |
| 30th | 3:53:07 | 4:20:24 | 4:02:56 |
| Median (50th) | 4:14:29 | 4:42:09 | 4:26:33 |
| 70th | 4:38:26 | 5:07:36 | 4:52:18 |
| Back 10% (90th) | 5:25:26 | 5:56:31 | 5:41:45 |
Get your own projection in seconds — free, no signup, no wearable.
Marathon Time PredictorWhat is the average marathon finish time?
The average marathon finish time is about 4 hours 33 minutes worldwide. That figure comes from RunRepeat's State of Running study, which analyzed 107.9 million race results from 1986 to 2018 (Andersen, 2019). It is the largest study of race results ever done. The work was carried out with the IAAF, the sport's world governing body.
- 4:32:49
- average marathon finish time in 2018 across 107.9 million results (RunRepeat)
The average is one kind of number. The median is another. The median is the time of the runner right in the middle of the pack. Half finish faster. Half finish slower. Across 34.7 million results, the median marathon time is 4 hours 26 minutes 33 seconds (Nikolova, RunRepeat). The median sits a little faster than the average. A few very slow finishers pull the average back.
Both numbers feel slow to a trained runner. The reason is simple. They count everyone who crosses the line. New runners. Walkers. People out to raise money for a cause. The marathon draws huge crowds who only want to finish. So the typical time is not a racing time. If you train with a real plan, you will likely beat it by a wide margin.
Where do you sit in the marathon pack?
Your place in the pack depends on your gender and your finish time. The table above shows the spread. For men, the median is 4 hours 14 minutes 29 seconds. For women, it is 4 hours 42 minutes 9 seconds (Nikolova, RunRepeat). Beat your gender's median, and you are in the faster half.
The middle of the pack is wide. For men, half of all finishers land between about 3 hours 53 minutes and 4 hours 38 minutes. That is the gap from the 30th to the 70th percentile. For women, the same middle band runs from about 4 hours 20 minutes to 5 hours 8 minutes. Most runners live inside that band. The edges are where the fast and the slow sit.
A sub-4-hour marathon is a clear marker. It puts you ahead of about 70 percent of all finishers. For women, it beats 80 percent (Nikolova, RunRepeat). To reach the top 10 percent, a man needs about 3 hours 23 minutes. A woman needs about 3 hours 49 minutes. The top 1 percent starts near 2 hours 44 minutes for men and 3 hours 12 minutes for women.
These are percentile markers, not goals tied to your age. If you want a target built for your decade of life, our guide to a good marathon time by age breaks down the average and the strong time for each age group. This post is about the whole field and where you land in it.
Why has the average marathon time gotten slower?
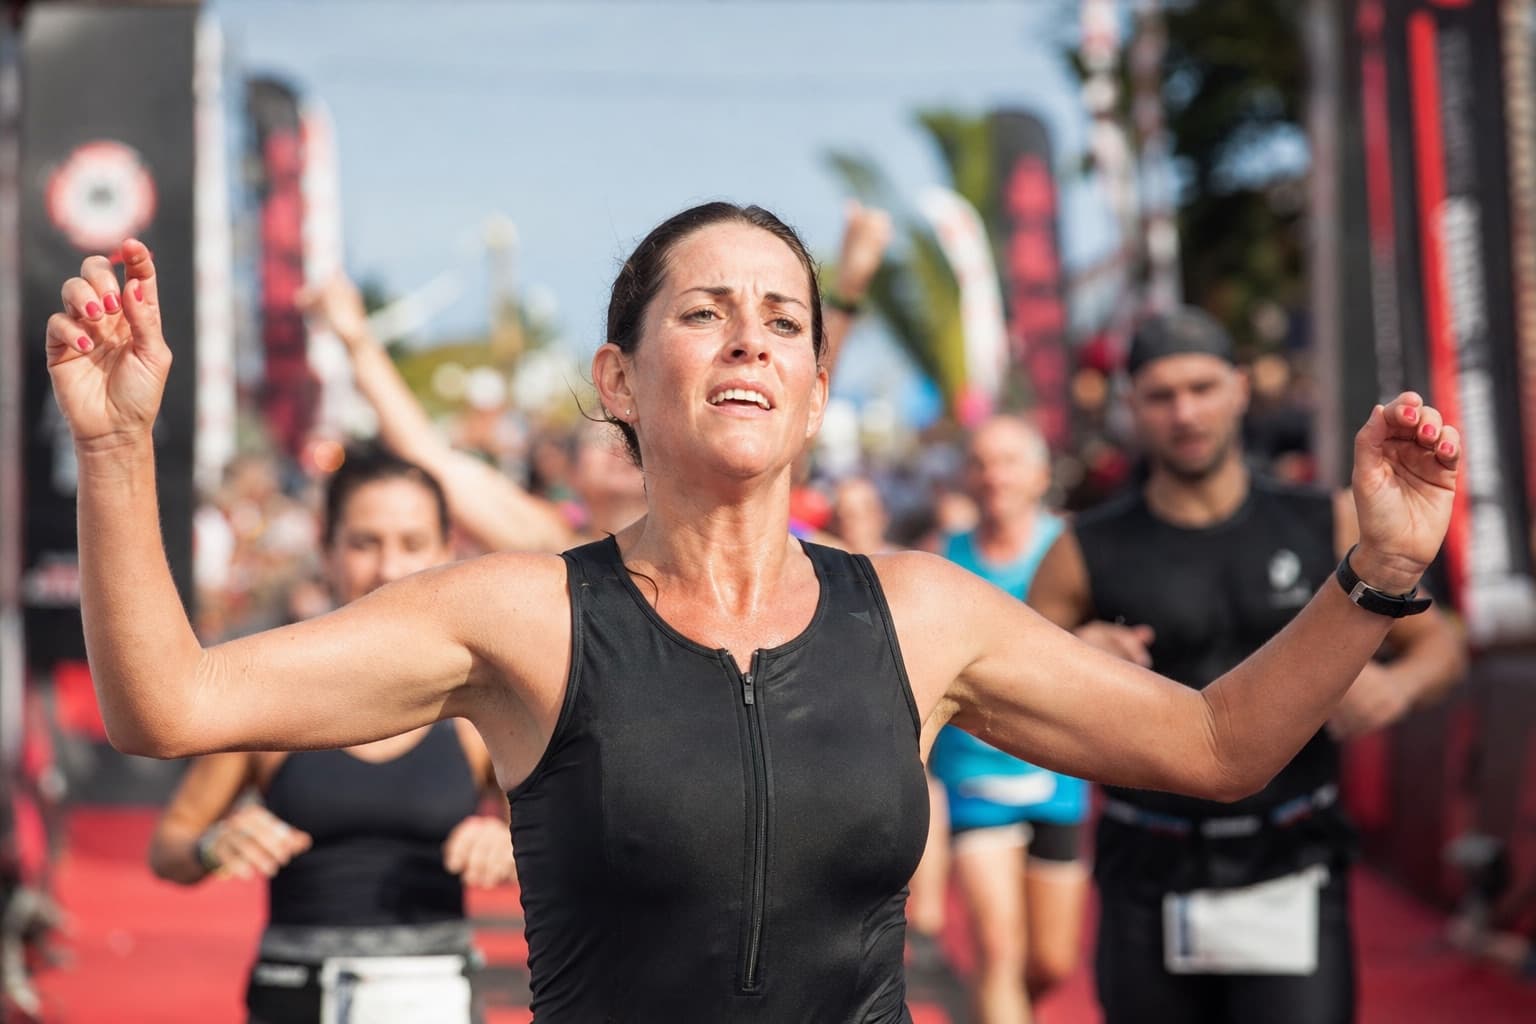
The average marathon time has gotten slower because the sport grew. In 1986, the average finish was 3 hours 52 minutes 35 seconds. By 2018, it was 4 hours 32 minutes 49 seconds (Andersen, 2019). That is a slowdown of 40 minutes and 14 seconds in just over three decades.
- 40:14
- slower the average marathon has become since 1986 (RunRepeat State of Running)
This is not a sign that runners got worse. It is a sign that the crowd changed. The marathon used to be a niche test. Few people ran one. The ones who did tended to be serious. As the race went mainstream, more first-timers joined. More people came to finish, not to race. The average reflects who shows up, and many more slow runners now show up.
The data backs this up. Most of the slowdown happened early. The average jumped 36 minutes between 1986 and 2001. Since 2001, it has crept up by only 4 minutes (Andersen, 2019). The big shift came when the masses first arrived. The field is also older. The average runner aged from 35.2 years in 1986 to 39.3 years in 2018.
A peer-reviewed study of the New York City Marathon found the same pattern. Across 1.2 million finishers over half a century, participation rose sharply and average race times rose with it (Vitti et al., 2020). Broader fields mean slower averages. The slowdown is about who runs, not about lost talent.
Did men and women slow down the same way?
No. Men and women did not slow down the same way. Men kept getting slower across the whole period. Women slowed at first, then turned the trend around. From 1986 to 2001, women's average time rose from 4 hours 18 minutes to 4 hours 56 minutes. Since 2001, women have actually gotten about 4 minutes faster (Andersen, 2019).
Men did not see that rebound. The men's average rose from 3 hours 48 minutes in 1986 to 4 hours 15 minutes by 2001, then added another 7 minutes after that. So men account for most of the field-wide slowdown in recent decades. A separate RunRepeat mega study of 24.7 million results reached the same split. It found that men slowing down explained 54 percent of the trend, while the rise in slower female runners explained 46 percent (RunRepeat, 2019).
There is a bigger story behind the gender gap. The number of women running marathons has soared. In 2018, for the first time, more than half of all race finishers were women, at 50.24 percent (Andersen, 2019). The New York City study saw the same shift, with the men-to-women ratio falling year after year (Vitti et al., 2020). The field is more balanced than ever.

How does average marathon time change by age and gender?
Average marathon time changes slowly with age and sharply with gender. Gender splits the field into two clear curves. Across every percentile, the men's time is faster than the women's. The median gap is about 28 minutes. That gap holds whether you look at the fast end or the slow end of the pack.
Age moves the whole field more gently. The marathon rewards years of steady training, so the drop with age is small for a long time. But the average runner is also aging, which nudges the typical time slower over the years (Andersen, 2019). For the full age-group breakdown, with the average and the strong time for each decade, read our guide to a good marathon time by age.
One tool helps you compare across age and gender on a level field. It is called age grading. It scores your time against the best possible time for your age and sex. That lets a 55-year-old and a 30-year-old compare results fairly. Our guide to how age grading works shows you how to read your own score. It turns a raw finish time into a fair percentile.
Average vs median: which number should you use?
Use the median, not the average, to judge where you stand. The average gets dragged slow by a small number of very slow finishers. The median is steadier. It is the true middle of the pack. For most runners, the median is the honest mirror. Beat it, and you are in the faster half of your gender.
The percentile table is even better than a single number. It shows the full shape of the field. You can see the fast edge, the wide middle, and the slow tail. A finish time alone tells you little. The same time means different things for a man and a woman. It means different things at the front and the back of the pack. The percentile turns your time into your place.
But there is a limit to all of this. A percentile tells you where you rank today. It cannot tell you what you are capable of. Two runners with the same finish time can have very different ceilings. One may be near their limit. The other may have 20 minutes still in the tank. A ranking chart treats them as equal. They are not.
Why your percentile is only a starting point
A percentile is a snapshot of the crowd. It is not a map of your potential. To find your real ceiling, you need a tool that reads your own training, not a population chart. This is where a static number falls short and a smarter model takes over.
PIRX is a proprietary machine-learning prediction engine. It does not guess from your age and gender. It reads your real runs. It scores the parts of your fitness that set your marathon time. It then gives you a Projected Time, with a Supported Range that shows the spread of likely finishes from your current data. A one-size-fits-all calculator cannot do this. Neither can a wrist VO2 max estimate. They treat every runner the same.
PIRX breaks your marathon into 5 performance drivers: Aerobic Base, Threshold Density, Speed Exposure, Load Consistency, and Running Economy. Each driver shows its gain in seconds, not a vague score. For the marathon, Aerobic Base and Load Consistency carry the most weight, because the race lives on deep volume and steady training. Your lowest driver is your biggest gap. It tells you what to fix first.
- 98%
- validated prediction accuracy (PIRX users)
The projection recalculates after every synced activity. A visible change shows only when the structural change is at least 2 seconds, so you see real progress, not noise. When you have a clear target, like a sub-4 marathon, you can train the exact driver that holds you back. To go deeper on how projections work, read our complete guide to predicting your race time.
See where you sit and where you could go
Stop measuring yourself against a crowd chart. A percentile shows the pack. It cannot show your potential, your true ceiling, or the seconds hidden in your training. PIRX can. Connect your Garmin, COROS, or Strava in under a minute. See your Projected Marathon Time, your Supported Range, and the drivers that hold you back. Then watch the number drop as you train the right gaps. Free, no signup needed.
Get your own projection in seconds — free, no signup, no wearable.
Marathon Time PredictorSources
- Nikolova, V. / RunRepeat. Marathon finish time percentiles. (Marathon times by gender from 34.7 million results. The median is 4:26:33 for all, 4:14:29 for men, and 4:42:09 for women.)
- Andersen, J.J. / RunRepeat (2019). The State of Running 2019. (107.9 million results, 1986 to 2018. The average rose from 3:52:35 to 4:32:49. Women were half the field by 2018.)
- RunRepeat (2019). Why runners are slower now. (24.7 million results. Men slowing drove 54 percent of the trend. More slower women drove 46 percent.)
- Vitti et al. (2020). The New York City Marathon study. Research in Sports Medicine. (1.2 million finishers. As more people ran, the average time rose.)
Already know your number? Start your 14-day free trial