Performance Trends
What We're Learning (Analysis)
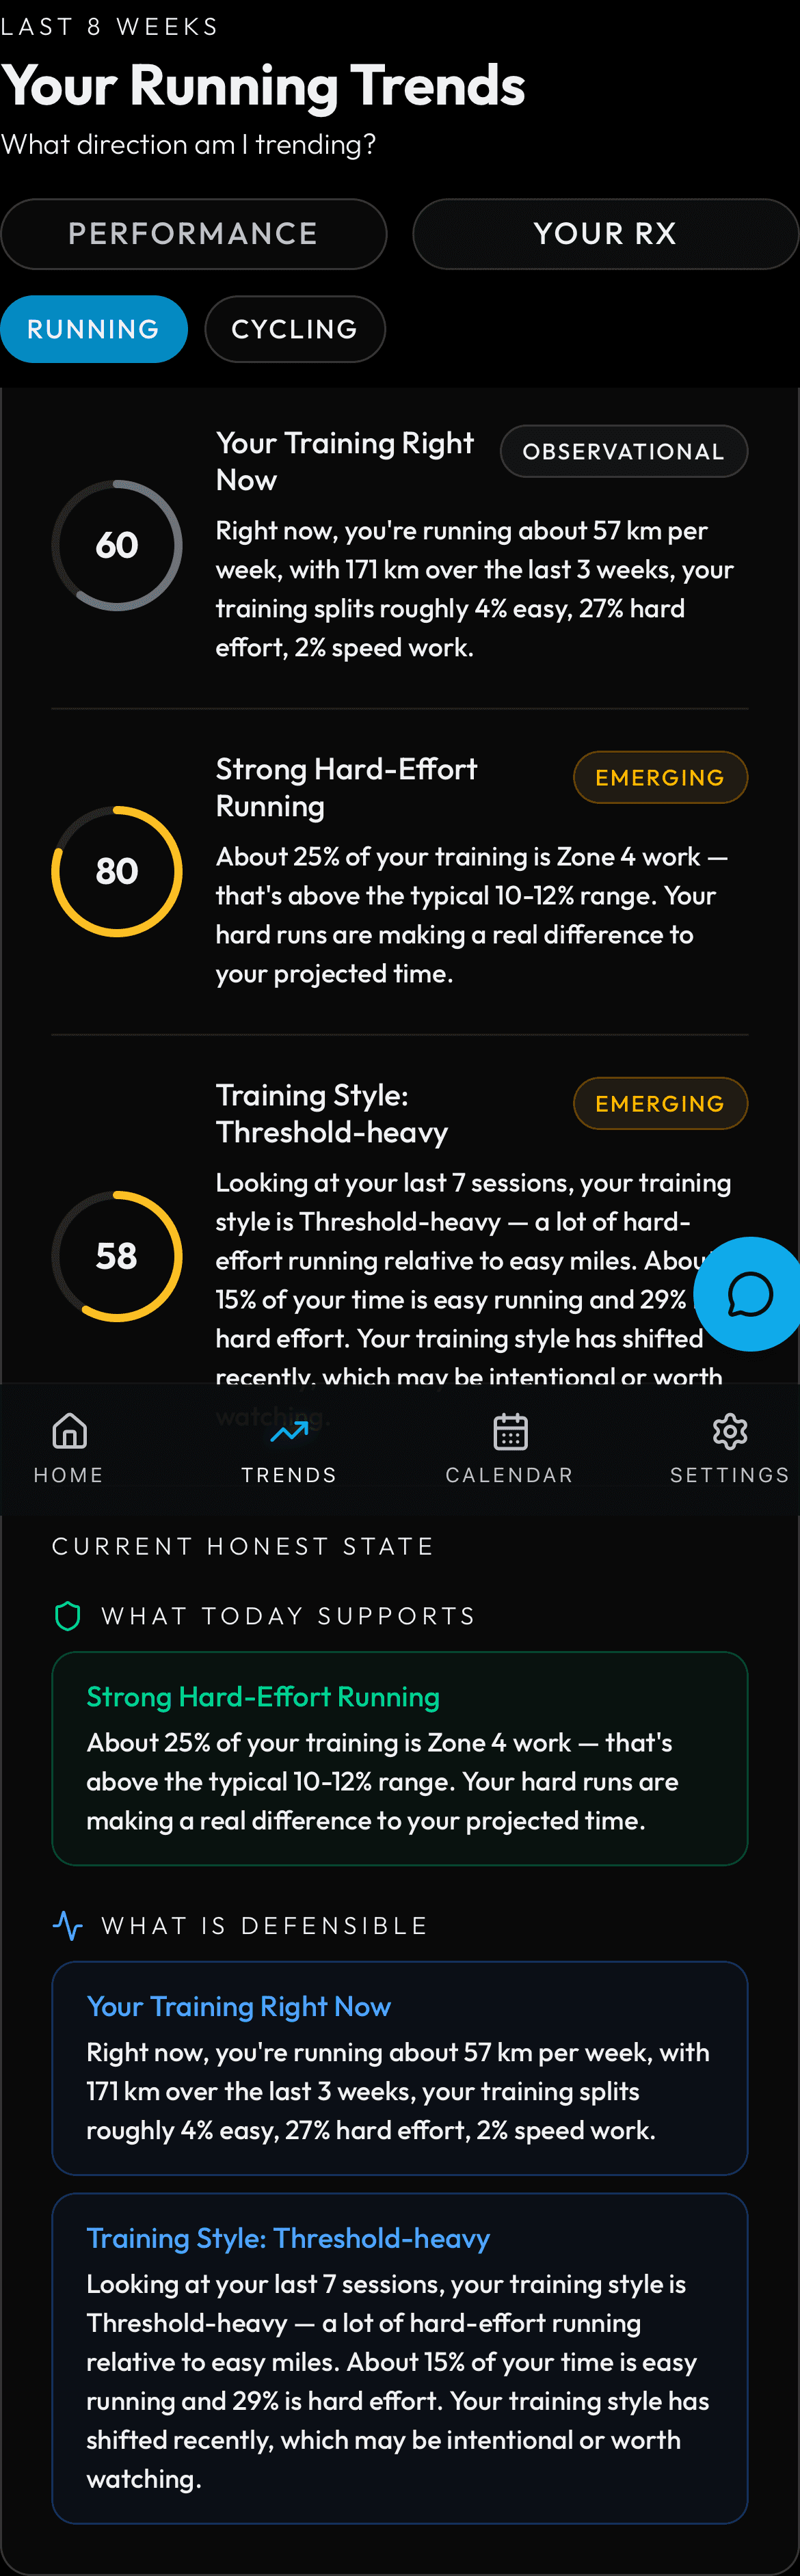
Source: (inline in performance/page.tsx)
What You See
Shows your 'Structural Identity' (a label describing your runner type). Below are insight cards with a title, description, a status badge (Observational, Emerging, or Supported), and a confidence bar showing how sure PIRX is about each insight.
How the Numbers Work
PIRX analyzes patterns in your training history to detect recurring behaviors and their effects. Insights start as 'Observational' when first detected, move to 'Emerging' as more evidence appears, and become 'Supported' when the pattern is confirmed across multiple weeks of data.
Step by Step
Models & algorithms used: KMeans
- The LearningModule runs periodically as a Celery task. It performs three analyses.
- Correlation analysis: Pearson and Spearman correlations are computed between each training feature (rolling distance, zone percentages, ACWR, pace metrics) and projection changes. Only correlations with p-value below 0.05 and absolute r above 0.4 are kept as meaningful insights.
- KMeans clustering: zone-intensity vectors from your recent blocks are clustered into up to 4 groups (k is chosen by silhouette score). Each cluster is labeled as Polarized, Pyramidal, Threshold-Heavy, or Mixed based on zone proportions. Your dominant cluster becomes your Structural Identity.
- Confidence tiers: insights start as Observational (1-3 weeks of evidence), advance to Emerging (4-6 weeks), and reach Supported (7+ weeks of consistent signal). The browser maps these tiers to progress bar width: one-third, two-thirds, or full.